VALUATION WARNING: Overvalued stocks now make up 68.72% of our stocks assigned a valuation and 35.61% of those equities are calculated to be overvalued by 20% or more. Fifteen sectors are calculated to be overvalued.
We use trading data to provide forecast estimates for a variety of time horizons for almost ever equity in our database. Our Buy/Sell/Hold recommendations are based upon the 1-year forecast return figure. Using valuation and forecast figures, you can rank and rate our covered stocks against each other, to find out, in an objective and systematic way, the most attractive investment targets based on your own risk/reward parameters. We re-calculate the entire database every trading day, so you are assured that every proprietary valuation and forecast datapoint is as up-to-date as possible.
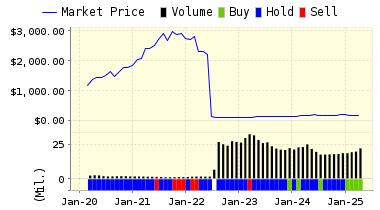
For today’s bulletin, we take a look at internet giant Google Alphabet. The Company reports earnings after the close of trading today.
Alphabet Inc. (GOOG) is engaged in technology business. The Company provides web-based search, advertisements, maps, software applications, mobile operating systems, consumer content, enterprise solutions, commerce and hardware products through its subsidiaries. Alphabet Inc., formerly known as Google Inc., is headquartered in Mountain View, California.
VALUENGINE RECOMMENDATION: ValuEngine continues its HOLD recommendation on Google Alphabet for 2017-01-25. Based on the information we have gathered and our resulting research, we feel that Google Alphabet has the probability to ROUGHLY MATCH average market performance for the next year. The company exhibits ATTRACTIVE Company Size but UNATTRACTIVE Price Sales Ratio.
You can download a free copy of detailed report on Google/Alphabet Inc. (GOOG). from the link below.
|
ValuEngine Forecast
|
||
|
Target
Price* |
Expected
Return |
|
|---|---|---|
|
1-Month
|
833.18 | -0.30% |
|
3-Month
|
830.72 | -0.59% |
|
6-Month
|
826.95 | -1.04% |
|
1-Year
|
805.71 | -3.59% |
|
2-Year
|
823.61 | -1.44% |
|
3-Year
|
856.75 | 2.52% |
|
Valuation & Rankings
|
|||
|
Valuation
|
n/a
|
Valuation Rank(?)
|
|
|
1-M Forecast Return
|
-0.30%
|
1-M Forecast Return Rank
|
|
|
12-M Return
|
17.42%
|
Momentum Rank(?)
|
|
|
Sharpe Ratio
|
0.73
|
Sharpe Ratio Rank(?)
|
|
|
5-Y Avg Annual Return
|
14.44%
|
5-Y Avg Annual Rtn Rank
|
|
|
Volatility
|
19.78%
|
Volatility Rank(?)
|
|
|
Expected EPS Growth
|
44.55%
|
EPS Growth Rank(?)
|
|
|
Market Cap (billions)
|
283.58
|
Size Rank
|
|
|
Trailing P/E Ratio
|
35.15
|
Trailing P/E Rank(?)
|
|
|
Forward P/E Ratio
|
24.31
|
Forward P/E Ratio Rank
|
|
|
PEG Ratio
|
0.79
|
PEG Ratio Rank
|
|
|
Price/Sales
|
3.32
|
Price/Sales Rank(?)
|
|
|
Market/Book
|
2.47
|
Market/Book Rank(?)
|
|
|
Beta
|
0.89
|
Beta Rank
|
|
|
Alpha
|
-0.06
|
Alpha Rank
|
|

DOWNLOAD A FREE SAMPLE OF OUR GOOGLE ALPHABET (GOOG) REPORT BY CLICKING HERE
ValuEngine Market Overview
|
Summary of VE Stock Universe
|
|
|
Stocks Undervalued
|
31.28%
|
|
Stocks Overvalued
|
68.72%
|
|
Stocks Undervalued by 20%
|
13.76%
|
|
Stocks Overvalued by 20%
|
35.61%
|
ValuEngine Sector Overview
|
Sector
|
Change
|
MTD
|
YTD
|
Valuation
|
Last 12-MReturn
|
P/E Ratio
|
|
0.81%
|
3.82%
|
3.82%
|
24.30% overvalued
|
41.92%
|
25.45
|
|
|
1.02%
|
4.08%
|
4.08%
|
22.43% overvalued
|
31.92%
|
20.46
|
|
|
0.91%
|
4.43%
|
4.43%
|
21.28% overvalued
|
57.53%
|
28.48
|
|
|
1.15%
|
6.74%
|
6.74%
|
20.39% overvalued
|
35.78%
|
19.35
|
|
|
0.37%
|
9.07%
|
9.05%
|
18.75% overvalued
|
97.64%
|
29.27
|
|
|
0.53%
|
1.78%
|
1.78%
|
17.65% overvalued
|
27.77%
|
18.20
|
|
|
1.41%
|
3.43%
|
3.43%
|
17.44% overvalued
|
46.44%
|
21.34
|
|
|
0.18%
|
2.47%
|
2.47%
|
17.19% overvalued
|
26.87%
|
20.88
|
|
|
0.70%
|
1.98%
|
1.98%
|
15.05% overvalued
|
21.48%
|
24.70
|
|
|
0.95%
|
4.53%
|
5.11%
|
13.83% overvalued
|
27.33%
|
31.10
|
|
|
0.32%
|
2.64%
|
2.64%
|
12.64% overvalued
|
28.58%
|
22.19
|
|
|
1.43%
|
3.40%
|
3.40%
|
11.16% overvalued
|
42.40%
|
15.14
|
|
|
0.46%
|
2.39%
|
2.39%
|
8.82% overvalued
|
17.78%
|
24.08
|
|
|
0.76%
|
2.33%
|
2.33%
|
8.28% overvalued
|
28.39%
|
24.29
|
|
|
0.54%
|
0.07%
|
0.07%
|
2.05% overvalued
|
13.87%
|
23.21
|
|
|
0.56%
|
4.03%
|
4.03%
|
3.61% undervalued
|
6.31%
|
27.83
|