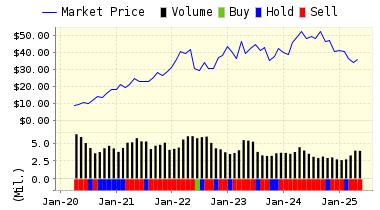
VALUATION WARNING: Overvalued stocks now make up 66.08% of our stocks assigned a valuation and 29.75% of those equities are calculated to be overvalued by 20% or more. Fourteen sectors are calculated to be overvalued.
We use trading data to provide forecast estimates for a variety of time horizons for almost ever equity in our database. Our Buy/Sell/Hold recommendations are based upon the 1-year forecast return figure. Using valuation and forecast figures, you can rank and rate our covered stocks against each other, to find out, in an objective and systematic way, the most attractive investment targets based on your own risk/reward parameters. We re-calculate the entire database every trading day, so you are assured that every proprietary valuation and forecast datapoint is as up-to-date as possible.
For today’s bulletin we used our website’s advanced-screening functions to search for the top-rated STRONG BUY US stock with valuation data that meets minimum liquidity requirements. Our leader is Teck Resources Limited.
If you follow our 5-Engine bulletins, we have been focused on Oils Energy firms as of late. In fact, three of the top-ten top STRONG BUY stocks are found in the Energy sector. But, we also see over-representation of other sectors such as Basic Materials. So, for today’s bulletin we take a look at Teck Resources (TECK). Teck lies third on our list. However, we have recently discussed the top-two firms–NRP and UPLMQ–and therefore today we provide data on TECK.
Teck Resources Limited (TECK) is a diversified resource company committed to responsible mining and mineral development with major business units focused on copper, metallurgical coal, zinc, gold and energy. It is a world leader in the production of copper, metallurgical coal and zinc, a significant producer of gold, molybdenum and specialty metals, with interests in several oil sands development assets. Headquartered in Vancouver, Canada, the company has expertise across the full range of activities related to mining, including exploration, development, smelting, refining, safety, environmental protection, product stewardship, recycling and research. The Company is actively exploring in countries throughout the Americas, Asia Pacific, Europe and Africa. Teck Resources Limited, formerly Teck Cominco Limited, is headquartered in Vancouver, Canada.
VALUENGINE RECOMMENDATION: ValuEngine continues its STRONG BUY recommendation on TECK RESOURCES for 2017-02-06. Based on the information we have gathered and our resulting research, we feel that TECK RESOURCES has the probability to OUTPERFORM average market performance for the next year. The company exhibits ATTRACTIVE Momentum and P/E Ratio.
You can download a free copy of detailed report on Teck Resources Limited (TECK) from the link below.
|
ValuEngine Forecast
|
||
|
Target
Price* |
Expected
Return |
|
|---|---|---|
|
1-Month
|
24.66 | 1.68% |
|
3-Month
|
24.37 | 0.48% |
|
6-Month
|
24.86 | 2.50% |
|
1-Year
|
29.19 | 20.39% |
|
2-Year
|
20.59 | -15.10% |
|
3-Year
|
16.85 | -30.51% |
|
Valuation & Rankings
|
|||
|
Valuation
|
16.09% undervalued
|
Valuation Rank(?)
|
|
|
1-M Forecast Return
|
1.68%
|
1-M Forecast Return Rank
|
|
|
12-M Return
|
463.95%
|
Momentum Rank(?)
|
|
|
Sharpe Ratio
|
-0.18
|
Sharpe Ratio Rank(?)
|
|
|
5-Y Avg Annual Return
|
-10.90%
|
5-Y Avg Annual Rtn Rank
|
|
|
Volatility
|
59.91%
|
Volatility Rank(?)
|
|
|
Expected EPS Growth
|
99.53%
|
EPS Growth Rank(?)
|
|
|
Market Cap (billions)
|
13.74
|
Size Rank
|
|
|
Trailing P/E Ratio
|
10.45
|
Trailing P/E Rank(?)
|
|
|
Forward P/E Ratio
|
5.24
|
Forward P/E Ratio Rank
|
|
|
PEG Ratio
|
0.11
|
PEG Ratio Rank
|
|
|
Price/Sales
|
2.31
|
Price/Sales Rank(?)
|
|
|
Market/Book
|
1.14
|
Market/Book Rank(?)
|
|
|
Beta
|
1.47
|
Beta Rank
|
|
|
Alpha
|
1.65
|
Alpha Rank
|
|
DOWNLOAD A FREE SAMPLE OF OUR TECK RESOURCES (TECK) REPORT BY CLICKING HERE
ValuEngine Market Overview
|
Summary of VE Stock Universe
|
|
|
Stocks Undervalued
|
33.92%
|
|
Stocks Overvalued
|
66.08%
|
|
Stocks Undervalued by 20%
|
13.86%
|
|
Stocks Overvalued by 20%
|
29.75%
|
ValuEngine Sector Overview
|
Sector
|
Change
|
MTD
|
YTD
|
Valuation
|
Last 12-MReturn
|
P/E Ratio
|
|
-0.73%
|
-0.15%
|
2.70%
|
21.84% overvalued
|
35.60%
|
24.45
|
|
|
-0.67%
|
-0.10%
|
2.78%
|
16.82% overvalued
|
28.97%
|
19.73
|
|
|
-0.29%
|
0.69%
|
1.96%
|
15.47% overvalued
|
26.02%
|
18.14
|
|
|
-0.33%
|
0.31%
|
4.80%
|
13.74% overvalued
|
30.24%
|
30.51
|
|
|
-0.39%
|
0.18%
|
2.57%
|
13.08% overvalued
|
33.73%
|
20.20
|
|
|
-1.04%
|
-0.85%
|
1.32%
|
12.03% overvalued
|
18.83%
|
22.72
|
|
|
-0.84%
|
-0.44%
|
0.94%
|
11.99% overvalued
|
20.09%
|
23.52
|
|
|
0.28%
|
1.69%
|
9.94%
|
10.07% overvalued
|
87.07%
|
27.51
|
|
|
-1.29%
|
0.00%
|
2.73%
|
9.06% overvalued
|
45.34%
|
28.78
|
|
|
-0.54%
|
-0.35%
|
4.36%
|
8.81% overvalued
|
31.00%
|
19.90
|
|
|
-0.68%
|
0.54%
|
2.00%
|
8.49% overvalued
|
19.64%
|
24.28
|
|
|
0.45%
|
0.16%
|
2.18%
|
8.49% overvalued
|
41.97%
|
14.63
|
|
|
0.08%
|
0.98%
|
2.84%
|
6.50% overvalued
|
42.62%
|
20.76
|
|
|
-0.49%
|
-0.45%
|
1.14%
|
3.86% overvalued
|
25.40%
|
24.18
|
|
|
-0.69%
|
-0.16%
|
-1.58%
|
0.80% undervalued
|
12.10%
|
22.90
|
|
|
-0.36%
|
1.05%
|
5.32%
|
1.57% undervalued
|
10.88%
|
26.98
|


