VALUATION WARNING: Overvalued stocks now make up 67.6% of our stocks assigned a valuation and 34.67% of those equities are calculated to be overvalued by 20% or more. Fifteen sectors are calculated to be overvalued.
ValuEngine Index Overview
|
Index
|
Week Open
|
Friday AM
|
Change
|
% Change
|
YTD
|
|
DJIA
|
19794.79
|
20097.42
|
302.63
|
1.53%
|
1.69%
|
|
NASDAQ
|
5546.64
|
5647.44
|
100.8
|
1.82%
|
4.91%
|
|
RUSSELL 2000
|
1351.41
|
1371.35
|
19.94
|
1.48%
|
1.05%
|
|
S&P 500
|
2267.78
|
2294.01
|
26.23
|
1.16%
|
2.46%
|
ValuEngine Market Overview
|
Summary of VE Stock Universe
|
|
|
Stocks Undervalued
|
32.4% |
|
Stocks Overvalued
|
67.6% |
|
Stocks Undervalued by 20%
|
14.18% |
|
Stocks Overvalued by 20%
|
34.67% |
ValuEngine Sector Overview
|
Sector
|
Change
|
MTD
|
YTD
|
Valuation
|
Last 12-MReturn
|
P/E Ratio
|
| Industrial Products |
-0.26%
|
3.69%
|
3.69%
|
23.33% overvalued
|
38.97%
|
25.30
|
| Multi-Sector Conglomerates |
-0.22%
|
3.86%
|
3.86%
|
21.53% overvalued
|
30.28%
|
20.46
|
| Oils-Energy |
0.20%
|
4.57%
|
4.57%
|
21.21% overvalued
|
52.90%
|
28.91
|
| Transportation |
-0.70%
|
5.92%
|
5.92%
|
19.50% overvalued
|
31.73%
|
19.14
|
| Basic Materials |
-0.91%
|
8.08%
|
8.06%
|
17.22% overvalued
|
92.81%
|
29.39
|
| Finance |
-0.04%
|
1.77%
|
1.77%
|
17.01% overvalued
|
26.01%
|
18.19
|
| Construction |
-0.14%
|
3.31%
|
3.31%
|
16.75% overvalued
|
43.57%
|
21.28
|
| Aerospace |
-0.73%
|
1.78%
|
1.78%
|
16.74% overvalued
|
25.96%
|
20.79
|
| Business Services |
-0.09%
|
1.94%
|
1.94%
|
13.58% overvalued
|
19.97%
|
24.55
|
| Computer and Technology |
-0.42%
|
4.20%
|
4.78%
|
12.83% overvalued
|
26.04%
|
30.91
|
| Utilities |
-0.07%
|
2.61%
|
2.61%
|
12.47% overvalued
|
24.53%
|
22.18
|
| Auto-Tires-Trucks |
-0.34%
|
3.15%
|
3.15%
|
10.17% overvalued
|
38.67%
|
15.05
|
| Consumer Staples |
-0.41%
|
2.04%
|
2.04%
|
7.94% overvalued
|
14.85%
|
23.92
|
| Consumer Discretionary |
-0.63%
|
1.77%
|
1.77%
|
7.37% overvalued
|
25.80%
|
24.19
|
| Retail-Wholesale |
-1.12%
|
-0.69%
|
-0.69%
|
0.71% overvalued
|
11.20%
|
22.97
|
| Medical |
-0.27%
|
3.82%
|
3.82%
|
4.48% undervalued
|
5.61%
|
27.61
|
Sector Talk–Construction
Below, we present the latest data on Construction stocks from our Professional Stock Analysis Service. Top- five lists are provided for each category. We applied some basic liquidity criteria–share price greater than $3 and average daily volume in excess of 100k shares.
Top-Five Construction Stocks–Short-Term Forecast Returns
|
Ticker
|
Name
|
Mkt Price
|
Valuation (%)
|
Last 12-M Return (%)
|
|
CCS
|
CENTURY COMMUNT
|
23.45
|
N/A
|
59.09%
|
|
GRAM
|
GRANA Y MONTERO
|
5.26
|
N/A
|
139.09%
|
|
TMHC
|
TAYLOR MORRISON
|
21.57
|
21.18%
|
81.72%
|
|
WLH
|
WILLIAM LYON HM
|
17.83
|
-6.78%
|
55.99%
|
|
PGEM
|
PLY GEM HOLDING
|
16.6
|
18.36%
|
71.13%
|
Top-Five Construction Stocks–Momentum
|
Ticker
|
Name
|
Mkt Price
|
Valuation (%)
|
Last 12-M Return (%)
|
|
GV
|
GOLDFIELD CORP
|
6.45
|
N/A
|
403.91%
|
|
WLDN
|
WILLDAN GROUP
|
26.54
|
82.34%
|
215.20%
|
|
ORN
|
ORION GROUP HLD
|
11.01
|
23.38%
|
214.57%
|
|
MTZ
|
MASTEC INC
|
41.55
|
50.66%
|
190.15%
|
|
TPC
|
TUTOR PERINI CP
|
32.4
|
63.01%
|
172.96%
|
Top-Five Construction Stocks–Composite Score
|
Ticker
|
Name
|
Mkt Price
|
Valuation (%)
|
Last 12-M Return (%)
|
|
WLH
|
WILLIAM LYON HM
|
17.83
|
-6.78%
|
55.99%
|
|
MTH
|
MERITAGE HOMES
|
37.55
|
-6.87%
|
33.63%
|
|
PHM
|
PULTE GROUP ONC
|
21.18
|
-1.42%
|
29.70%
|
|
KBH
|
KB HOME
|
17.16
|
1.29%
|
64.84%
|
|
TPH
|
TRI POINTE GRP
|
12.75
|
-4.26%
|
25.12%
|
Top-Five Construction Stocks–Most Overvalued
|
Ticker
|
Name
|
Mkt Price
|
Valuation (%)
|
Last 12-M Return (%)
|
|
WLDN
|
WILLDAN GROUP
|
26.54
|
82.34%
|
215.20%
|
|
TPC
|
TUTOR PERINI CP
|
32.4
|
63.01%
|
172.96%
|
|
GVA
|
GRANITE CONSTRU
|
58.83
|
53.71%
|
53.28%
|
|
MTZ
|
MASTEC INC
|
41.55
|
50.66%
|
190.15%
|
|
URI
|
UTD RENTALS INC
|
127.06
|
49.55%
|
123.34%
|
Free Download for Readers
As a bonus to our Free Weekly Newsletter subscribers,
we are offering a FREE DOWNLOAD of one of our Stock Reports
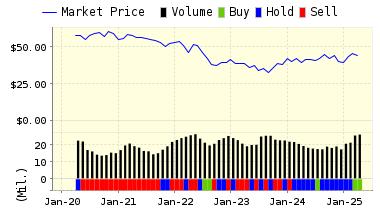
Verizon Communications (VZ), formed by the merger of Bell Atlantic and GTE, is one of the world’s leading providers of high-growth communications services. Verizon companies are the largest providers of wireline and wireless communications in the United States. Verizon is also the world’s largest provider of print and on-line directory information.
VALUENGINE RECOMMENDATION: ValuEngine continues its HOLD recommendation on Verizon Communications for 2017-01-26. Based on the information we have gathered and our resulting research, we feel that Verizon Communications has the probability to ROUGHLY MATCH average market performance for the next year. The company exhibits ATTRACTIVE Company Size but UNATTRACTIVE Book Market Ratio.
You can download a free copy of detailed report on Verizon Communications (VZ) from the link below.
Read our Complete Detailed Valuation Report on Verizon (VZ) HERE.
|
ValuEngine Forecast
|
||
|
Target
Price* |
Expected
Return |
|
|---|---|---|
|
1-Month
|
49.23 | 0.22% |
|
3-Month
|
49.37 | 0.50% |
|
6-Month
|
48.76 | -0.73% |
|
1-Year
|
50.45 | 2.70% |
|
2-Year
|
51.18 | 4.19% |
|
3-Year
|
46.51 | -5.32% |
|
Valuation & Rankings
|
|||
|
Valuation
|
0.63% undervalued | Valuation Rank(?) |
|
|
1-M Forecast Return
|
0.22% | 1-M Forecast Return Rank |
|
|
12-M Return
|
1.80% | Momentum Rank(?) |
|
|
Sharpe Ratio
|
0.35 | Sharpe Ratio Rank(?) |
|
|
5-Y Avg Annual Return
|
5.71% | 5-Y Avg Annual Rtn Rank |
|
|
Volatility
|
16.20% | Volatility Rank(?) |
|
|
Expected EPS Growth
|
1.81% | EPS Growth Rank(?) |
|
|
Market Cap (billions)
|
203.83 | Size Rank |
|
|
Trailing P/E Ratio
|
12.69 | Trailing P/E Rank(?) |
|
|
Forward P/E Ratio
|
12.47 | Forward P/E Ratio Rank |
|
|
PEG Ratio
|
7.02 | PEG Ratio Rank |
|
|
Price/Sales
|
1.59 | Price/Sales Rank(?) |
|
|
Market/Book
|
9.27 | Market/Book Rank(?) |
|
|
Beta
|
0.39 | Beta Rank |
|
|
Alpha
|
0.11 | Alpha Rank |
|
ValuEngineCapital Money Management
Services
We are pleased to announce that ValuEngine Capital has begun trading for our clients. ValuEngine Capital, a registered investment advisory firm, offers our clients investment-management services based on industry-leading ValuEngine research. ValuEngine Capital melds the cutting-edge financial theory of ValuEngine’s award-winning quantitative independent research with the best real-world Wall St. practices. ValuEngine Capital offers refined investment portfolios for investors of all risk-reward profiles.
ValuEngine Capital is offering several investment strategies to clients, including the the ValuEngine View Strategy and the ValuEngine Diversified Strategy
Professional Portfolio Management Services
ValuEngine View Strategy: The ValuEngine View Strategy is the product of a sophisticated stock valuation model that was first developed by ValuEngine’s academic research team.
- It utilizes a three factor approach: fundamental variables such as a company’s trailing 12-month Earnings-Per-Share (EPS), the analyst consensus estimate of the company’s future 12-month EPS, and the 30-year Treasury yield are all used to create a more accurate reflection of a company’s fair value.
- A total of eleven additional firm specific variables are also used. The ValuEngine View portfolio is constructed by integrating both our Aggressive Growth—based on the Valuation Model–and Diversified Growth—based on the Forecast Model– Portfolio Strategies.
- The ValuEngine View Strategy is constructed by integrating this model along with some basic rules for market capitalization and industry diversification. The portfolio has 15 stocks and is rebalanced once each month.
Strategies To Suit All Investor Types
The ValuEngine Diversified Strategy: The ValuEngine Diversified Strategy invests in a variety of asset classes in order to provide investors with stable returns and a high- dividend yield coupled with significantly lower risk than single-asset products.
- The ValuEngine Diversified Strategy may include ETFs focused on commodities, stock indices, REITS, bonds, emerging markets, and other suitable products.
- By reaping the benefits of diversification, the ValuEngine Diversified Strategy seeks to remain resilient during times of market volatility.
- The ValuEngine Diversified Strategy is designed for investors seeking management for their IRA and other retirement funds as well as those whose risk-profile is not suitable for our other strategies.
For more information, please contact us by email at info@ValuEngineCapital.com
or by phone at (407) 308-5686.
Or, sign up online with our easy-to-use portal HERE:
![]()
ValuEngine.com is an independent research provider, producing buy/hold/sell recommendations, target price, and valuations on over 7,000 US and Canadian equities every trading day.