Modern portfolio construction is evolving beyond traditional mutual funds, with 62% of ETF investors now envisioning portfolios composed entirely of exchange-traded vehicles. This shift allows for greater transparency, lower costs, and more precise tactical control. By combining individual stocks for alpha generation with ETFs for broad beta exposure, advisors can build highly customized strategic and asset allocation models tailored to specific client needs.
Trade ValuEngine supported portfolio strategies, www.ValuEngineCapital.com
A strong portfolio starts with reliable forecasting. The ValuEngine Rating System updates daily, assigning an “Engine Rating” from 1 (Strong Sell) to 5 (Strong Buy) across more than 4,000 stocks and 600 ETFs. Top picks come from the “5-Engine” group, aiming for over 12% annual returns. ETFs cover sector or style gaps and ratings steer advisors toward undervalued areas and away from overpriced segments. ValuEngine uses valuation models that compare current prices to historical data such as earnings and macro factors like the 30-year Treasury yield.
Strategic portfolio asset class allocations should align with a client’s “downside pain threshold”. Risk tolerance is the intersection of a client’s emotional willingness to endure volatility and their financial capacity to absorb losses. Any division into three categories according to perceived risk tolerance is an oversimplification but a useful framework. Classically, these categories are: aggressive; moderate and conservative. A description for each follows.
Free Trial: Direct Access to ValuEngine Research on over 5,000 stocks and 700 ETFs HERE
Aggressive Portfolios: Weighted heavily toward 5-Engine (strong buy) stocks with one or two growth-oriented ETFs being considered. These portfolios should seek maximum capital appreciation within a prudent framework that includes diversification and liquidity constraints.
Moderate Portfolios: These portfolios focus equally on growth and capital preservation. The targeted asset mix should be a classic 60% equity / 40% fixed income ETFs. A general framework might be to focus mostly but not exclusively on 4- and 5-Engine stocks and ETFs. Harness volatility by eliminating 25% of largest standard deviation stocks and selecting only stocks that pay a dividend. Mitigate equal-weighted scheme’s implicit bias against the largest market cap stocks by allocating 20% of equity position to market-cap weighted total market portfolio.
Conservative Portfolios: Focus on capital preservation while seeking appreciation at least in line with inflation with strong diversification between assets. About 70% of the portfolio should go into fixed income and/or gold ETFs given the latter’s historical ability to bounce highest during major equity recession even though gold prices and equity prices may be positively correlated in general. On the equity side, the main focus in equities should be on ETFs, not stocks, especially sector ETFs with low volatilities such as consumer staples, health care, and utilities alongside the sector-based ETF with the single strongest forecast return. However, if any low-standard-deviation large cap stocks that get a 4 or 5 rating can be found, they may be included as well.
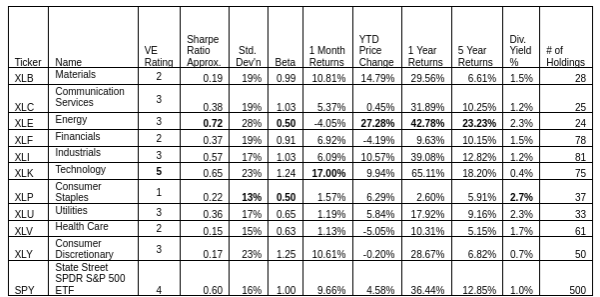
The rest of today’s blog focuses on options for conservative investors. In order to do that we start by analyzing the S&P 500 in terms of its component sectors.Since StateStreet select sector SPDR ETFs are the most liquid and prominent sector rotation vehicles, we evaluate them in the table below.
Current ValuEngine reports on all covered 5000+ stocks and ETFs can be viewed HERE
Energy (XLE) has been the big winner year-to-date and in annual and five-year returns but not in the past four weeks. Profit-taking after much exuberance resulted in the only losing StateStreet Select Sector SPDR in the group. The loss could be a temporary market adjustment. A few notes about XLE. Looking at Beta as a measure of market risk, its 0.50 ties it with Consumer Staples for being least reflective of upside and downside market movements. Sometimes, a low Beta gets confused with low price volatility and even simplified as low risk. That is definitely not true in this case. In fact, Energy has the highest price standard deviation and therefore the highest price swings of any sector, just frequently not in the same direction that the S&P 500 is moving. Another risk factor is the concentration of the weight of a portfolio in just a few stocks. Energy has the fewest number of S&P 500 stocks in its sector.
Consumer Staples (XLP) has the lowest price volatility and is traditionally a much more recommended sector for conservative portfolios. XLP seldom keeps up with more volatile sectors during market bull runs but is often one of the best safe havens in downturns. Looking at the sector’s return prospects, our forecast, consistent with our bullish forecast for S&P ETF SPYM, is that it will trail most other sectors. It is our only sector rated 1 (Strong Sell). This is the basic tradeoff between risk-and-return in anything but a down market heading towards a major correction before hitting its bottom. So far we seem to still be in a late-stage bull market. The normal relationships seem to apply. Very few stocks forecasted to be high price gainers have low price volatility, especially in a sector that is out of favor. There are exceptions. As individual securities are concerned, among general slim pickings for stocks rated Buy (4), let alone Strong Buy (5), there are two that qualify and also have below median volatility: Archer Daniels Midland (ADM) and US Food Holdings (USFD). Both stocks also have an above-median dividend yield.
Utilities (XLU) is an even more traditional sector for conservative portfolios and has the second lowest price volatility during the past five years. Its returns have been more competitive than those of XLP in the past few years. Since XLU is one of the more homogeneous sectors in terms of its constituents, just deploying that ETF will suffice as at least a 10 – 20% chunk of a conservative equity core.
Current ValuEngine reports on all covered 5000+ stocks and ETFs can be viewed HERE
Another recourse that is getting increasingly popular with conservative investors are buffered ETFs. In fact, out of eight utilities sector stocks rated 4 or 5, the only one with a lower-than-median volatility is Canadian wireless provider Rogers Communications Corp. (RCI, US ticker). It is also undervalued according to our valuation model and currently has an annual dividend yield of 4% and a forward P/E under 11.
To the extent that the overall allocation is deemed conservative enough, it might be wise to consider adding some potential high-forecasted return stocks from our top-rated sector ETF, Technology (XLK). We found two that have relatively low price volatility and some dividend yield to accompany high-forecasted price gains. The first is Herndon, VA-based EPLUS, Inc. (PLUS), a leading provider of technology solutions to data centers. It is rated 4. It has a dividend yield of 1.2%, a forward P/E of 16.5, a beta of 1 and below-sector-median price volatility. It also is more than 30% undervalued by our valuation model. The other tech stock to take a look at for limited price volatility and a 4 rating is venerable Texas Instruments (TXN). It has below-median volatility and a yield of 2%. The only downside is above average volatility as our valuation model considers it more than 50% overvalued.
Finally, no discussion today of core equity holdings for conservative portfolios would be complete without a discussion of buffered ETFs also called “defined-outcome” ETFs. These ETFs are not rated by ValuEngine, so we have referenced the ETF Database for the data. As of early 2026, there are 471 buffered ETFs (also known as defined-outcome ETFs) available in the U.S. market out of a total 4,707, almost precisely 10% . This segment, which did not exist before 2018, has seen very rapid growth, with assets under management (AUM) reaching approximately $84 billion across 20 different issuers. The market is heavily dominated by two pioneers that control over 85% of the category’s market share. The first is Innovator Capital Management, the creator of the first buffered ETF in 2018, managing over $31 billion across 135+ strategies. The AUM leader is First Trust Cboe Vest, a partnership, with approximately $41 billion across roughly 110 ETFs as of March 2026. Next in line by AUM are AllianzIM, BlackRock (iShares), PGIM (Prudential); Pacer ETFs, Calamos Investments, J.P. Morgan; AllianceBernstein, Global X, TrueShares, and Parametric. Most buffered ETFs are built on monthly cycles. If you miss the start of a specific “series” (e.g., the January series), you can look for laddered ETFs from providers like First Trust or Pacer that bundle all 12 months into a single ticker to provide continuous protection.
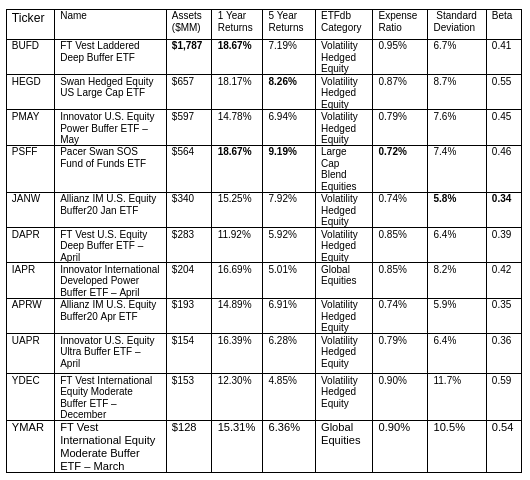
This chart lists the top ETFs that meet the AUM threshold of over $100 million.
Current ValuEngine reports on all covered 5000+ stocks and ETFs can be viewed HERE
Free Trial: Research on over 5,000 stocks and 700 ETFs HERE
With more than 470-and-counting ETFs in this category, innovations abound in the types of buffer, the index or indexes being hedged, whether it’s a fund of funds, the depth of the buffer, etc. There are many more variations than represented in this top 10 list, but this is certainly good enough to provide a launching point from which to explore.
Some of these ETFs are issued in series of 12 month enter/exits, sometimes reflected clearly in the ticker. These need to be bought and sold in the indicated month in order to expect no greater losses than the downside buffer of the series. For example, Innovator Capital Management offers seven distinct downside buffer levels across its suite of Defined Outcome ETFs. These products are designed to provide market exposure up to a cap while protecting against a specific percentage of losses over a set outcome period.
As of early 2026, the available buffer levels include:
- 5% Buffer: Typically found in Managed or Dual Directional strategies;
- 9% Buffer: Protects against the first 9% of losses;
- 10% Buffer: Used in standard and Dual Directional offerings;
- 15% Buffer: “Power Buffers,” protecting against the first 15% of losses;
- 20% Buffer: Often utilized for shorter three-month (quarterly) outcome periods;
- 30% Buffer: “Ultra Buffers,” protecting against losses from -5% to -35%;
- 100% Buffer: “Equity Defined Protection ETFs” designed to provide full downside protection before fees.
The 100% Buffer indicates zero losses if held May to May for ZMAY. These have been around less than a month and have not yet accumulated the minimum amount of assets but they have certainly elicited a lot of interest. Obviously, the tighter the buffer is to zero-losses, the more upside the ETF must sacrifice. However, getting equity participation with no downside through an ETF is an attention-catching concept.
Getting back to analyzing the ETFs included in the table, they all have a few commonalities. The first is high fees – from 0.72% to 0.95%. The second is to realize there is no dividend stream in these products to provide an income cushion against volatility as is provided with buy/write ETFs. The third is far less price volatility than SPY, the StateStreet SPDR Trust with an annual Standard Deviation of 17%. That said, there is quite a range represented here from a low of 5.8% by JANW to a high of 11.7% by YDEC. JANW also has the lowest Beta, 0.34. The winner in terms of returns was PSFF, Pacer Swan SOS Fund of Funds ETF with the best 5-year return and tied for the best 1-year return. Fourth, this Pacer ETF also offers the lowest expense ratio and a standard deviation of just 7.4%. A fifth difference with PSFF is that it is a fund-of-fund managing 13 securities rather than the norm of 2 or 3 securities, generally a benchmark index ETF, a money market fund and a long-dated option.
Trade ValuEngine supported portfolio strategies, www.ValuEngineCapital.com
We expect there will be more innovations and demand in this category in the years ahead. This will be especially true in periods of great uncertainty and high volatility. These, of course, are just a few of the ways that client portfolios seeking capital protection with moderate appreciation can be addressed. Figuring out the right combination and when for the client takes time and research, is why advisors are hired.
Herb Blank
ValuEngine Chief Quantitative Analyst
www.ValuEngine.com (Valuengine, Inc) is a stock valuation and forecasting service founded by Ivy League finance academics. VE utilizes the most advanced quantitative techniques and analysis available to analyze over 4,200 US stocks, 700 US ETFs, and 1,000 Canadian stocks. Fair market valuations, forecast target prices, and buy/hold/sell recommendations are updated DAILY.
www.ValuEngineCapital.com (ValuEngine Capital Management, LLC) is a Registered Investment Advisory firm that trades a variety of different portfolios based upon the ValuEngine.com research models. Each portfolio has a different risk/return profile, so clients can be placed in strategies that fit their specific investment needs.
BLOG.VALUENGINE.COM for the full history of ValuEngine.com financial blog posts
_____________________________________________________________________
Existing subscribers alert: ValuEngine has launched a completely redesigned and new website! Please check it out at ww2.ValuEngine.com
Free trials will full access to over 5,000 stocks, 15 sectors, over 200 industries, and 700 ETFs updated DAILY to respond to market changes HERE