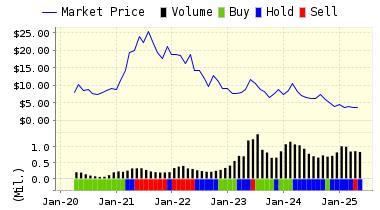
For today’s bulletin, we discuss falling crude oil prices and take a look at Braskem SA $BAK and provide a link to download a FREE STOCK REPORT on the company
VALUATION WATCH: Overvalued stocks now make up 57.46% of our stocks assigned a valuation and 21.46% of those equities are calculated to be overvalued by 20% or more. Twelve sectors are calculated to be overvalued.
It’s been a while, but today we have some market issues related to the price of crude oil. A glut of oil in the US has resulted in a price decline that is dragging down broader indices. Concurrent with the report on the crude glut is other news that gasoline inventories have also increased.
One often thinks that lower energy prices will benefit the economy overall as well as stocks, but that is not always the case. They can act as a leading indicator for economic growth and also warn of difficulties in important oil producing regions across the US. Over the past few years we have seen market declines when crude oil declines, a correlation that could spell trouble moving forward.
Below, we present the latest data on Oil/Energy stocks from our Professional Stock Analysis Service. Top- five lists are provided for each category. We applied some basic liquidity criteria–share price greater than $3 and average daily volume in excess of 100k shares.
Top-Five Oil/Energy Stocks–Short-Term Forecast Returns
| Ticker | Name | Mkt Price | Valuation (%) | Last 12-M Return (%) |
| BAK | BRASKEM SA | 20.86 | 16.23% | 71.69% |
| HNRG | HALLADOR ENERGY | 8.23 | N/A | 83.30% |
| SXCP | SUNCOKE ENERGY | 17.2 | -0.13% | 48.28% |
| ARLP | ALLIANCE RES | 21.55 | -17.99% | 35.03% |
| AHGP | ALLIANCE HLDGS | 27.08 | -21.79% | 35.74% |
Top-Five Oil/Energy Stocks–Momentum
| Ticker | Name | Mkt Price | Valuation (%) | Last 12-M Return (%) |
| ARCH | ARCH COAL INC | 70.02 | N/A | 18768.23% |
| REN | RESOLUTE ENERGY | 41.88 | -11.20% | 1220.09% |
| TELL | TELLURIAN INC | 11.7 | N/A | 741.73% |
| LLEX | LILIS ENERGY | 5.03 | N/A | 465.17% |
| AMRS | AMYRIS INC | 3.6 | 48.48% | 458.14% |
Top-Five Oil/Energy Stocks–Composite Score
| Ticker | Name | Mkt Price | Valuation (%) | Last 12-M Return (%) |
| AHGP | ALLIANCE HLDGS | 27.08 | -21.79% | 35.74% |
| ARLP | ALLIANCE RES | 21.55 | -17.99% | 35.03% |
| PBR | PETROBRAS-ADR C | 8.57 | 1.36% | 37.78% |
| BAK | BRASKEM SA | 20.86 | 16.23% | 71.69% |
| CLD | CLOUD PEAK EGY | 3.25 | -61.50% | 43.81% |
Top-Five Oil/Energy Stocks–Most Overvalued
| Ticker | Name | Mkt Price | Valuation (%) | Last 12-M Return (%) |
| EPE | EP ENERGY CP-A | 4.18 | 300.00% | -25.36% |
| SMLP | SUMMIT MIDSTRM | 23.05 | 173.45% | 2.76% |
| EXTN | EXTERRAN CORP | 27.52 | 117.16% | 111.37% |
| ATW | ATWOOD OCEANICS | 9.96 | 99.03% | -13.39% |
| ESV | ENSCO PLC | 6.25 | 83.59% | -41.04% |
Our top ranked Oil/Energy stock today is Braskem SA (BAK) figures as the largest petrochemical operation in Latin America and among the five largest private companies in Brazil. With industrial facilities located in Alagoas, Bahia, Sao Paulo and Rio Grande do Sul, Braskem produces primary base petrochemicals such as ethylene, propylene, benzene, caprolactam, DMT and termoplastic resins (polypropylene, polyethylene, PVC and PET) gas and GLP.
VALUENGINE RECOMMENDATION: ValuEngine continues its STRONG BUY recommendation on BRASKEM SA for 2017-06-06. Based on the information we have gathered and our resulting research, we feel that BRASKEM SA has the probability to OUTPERFORM average market performance for the next year. The company exhibits ATTRACTIVE P/E Ratio and Momentum.
Below is today’s data on Braskem SA (BAK):

| ValuEngine Forecast | ||
| Target Price* |
Expected Return |
|
|---|---|---|
| 1-Month | 21.16 | 1.43% |
| 3-Month | 21.25 | 1.86% |
| 6-Month | 22.33 | 7.07% |
| 1-Year | 24.45 | 17.21% |
| 2-Year | 26.21 | 25.62% |
| 3-Year | 28.38 | 36.05% |
| Valuation & Rankings | |||
| Valuation | 16.23% overvalued | Valuation Rank(?) | 27 |
| 1-M Forecast Return | 1.43% | 1-M Forecast Return Rank | 100 |
| 12-M Return | 71.69% | Momentum Rank(?) | 92 |
| Sharpe Ratio | 0.28 | Sharpe Ratio Rank(?) | 64 |
| 5-Y Avg Annual Return | 12.19% | 5-Y Avg Annual Rtn Rank | 74 |
| Volatility | 42.97% | Volatility Rank(?) | 38 |
| Expected EPS Growth | -52.23% | EPS Growth Rank(?) | 5 |
| Market Cap (billions) | 8.32 | Size Rank | 87 |
| Trailing P/E Ratio | 5.60 | Trailing P/E Rank(?) | 99 |
| Forward P/E Ratio | 11.72 | Forward P/E Ratio Rank | 76 |
| PEG Ratio | n/a | PEG Ratio Rank | n/a |
| Price/Sales | 0.61 | Price/Sales Rank(?) | 80 |
| Market/Book | 16.94 | Market/Book Rank(?) | 9 |
| Beta | 1.26 | Beta Rank | 26 |
| Alpha | 0.40 | Alpha Rank | 91 |
DOWNLOAD A FREE SAMPLE OF OUR BRASKEM SA (BAK) REPORT BY CLICKING HERE
ValuEngine.com is an Independent Research Provider (IRP), producing buy/hold/sell recommendations, target price, and valuations on over 5,000 US and Canadian equities every trading day.
Contact ValuEngine at (800) 381-5576 or support@valuengine.com
Visit www.ValuEngine.com for more information
ValuEngine Capital Management LLC is a Registered Investment Advisory (RIA) firm that trades client accounts using ValuEngine’s award-winning stock research.
Contact ValuEngine Capital at info@valuenginecapital.com
Visit www.ValuEngineCapital.com for more information
