By Herb Blank
Our short answer is yes. Generally speaking, the amount should be between 5% and 10% for diversification purposes. Gold doesn’t provide as much diversification as other assets in most time periods. But in the greatest equity market collapses in history when the endurance of the US market and dollar as the safe dollar haven of the future has fallen into question, the price of gold has always risen. In other words, I don’t advocate an allocation to gold because I think it’s an above-average long-term investment. It is not. It’s a defensive holding to mitigate huge and unexpected losses in the equity portfolio at a time you can least afford it.
All of the approximately 5,000 stocks, 16 sector groups, and 140 industries have been updated on www.ValuEngine.com.
Free Two Week Trial to all 5,000 plus equities covered by ValuEngine HERE
So, given the perceived need for an allocation to gold, what is the best way of doing so? In retail brokerage accounts, it is easy to simply buy shares of Exchange-Traded Products (ETPs). These are essentially depository receipts on gold. There are four major gold ETPs: GLD – SPDR Gold Trusts, IAU – iShares Gold Trust, BAR – Granite Shares Gold Trust, and GLDM – SPDR Mini Gold Trust. All four ETPs use a grantor trust structure which for IRS purposes is classified as pass-through security. In each case, underlying gold bars are held in vaults around the world.
Here’s one important fact taxable investors need to know as a consequence for the classification of pass-through securities. The capital gains tax rate may be considerably higher than for normal funds. Gold and hence shares of each of these funds is considered a collectible with a distinct and usually higher tax rate.
Since all four funds are based on the value of the gold they hold, any differences in investor returns is generally a function of the expense ratio as shown in the chart below:
| ETF | .Expense Ratio | 1-Year Ann. Tot. Return | 3-Year Ann. Total Return |
5-Year Ann. Total Return
|
10-Year Ann. Total Return. | |
| GLD | 0.40% | 16.56% | 11.45% | 8.58% | 2.63% | |
| IAU | 0.25% | 16.90% | 11.63% | 8.77% | 2.71% | |
| BAR | 0.17% | 16.97% | 11..66% |
|
N/A | |
| GLDM | 0.18% | 16.96% | N/A | N/A | N/A |
This table of annualized returns for 1- 3- 5- and 10-year periods ending 02/12/2021 based on NAVs according to ETF.com
The differences in the returns mirrors the differentials in expense ratios. Launched in August 2017 by upstart GraniteShares to compete on the basis of fees, BAR is definitely the disruptor of the group and still the lowest cost provider at 17 basis points. Blackrock lowered its fee to 25 basis points in 2017 in response to the competitive threat. SPDR kept GLD at its fee of 40 basis points while launching a new fund, GLDM with M standing for “Mini shares”, at 18 basis points.
Advisory Services based on ValuEngine research available:
ValuEngine Capital Management, LLC
Once again, if you already own GLD and have embedded capital gains, they would be taxed at the generally higher collectible rate so you may choose to hold those shares. Moreover, if you are a short-term trader, especially a long-short high-frequency trade, GLD with more than a billion dollars in average daily trading volume is probably your most comfortable choice.
However, for any investors buying new shares and intending to hold them more than a few weeks, I recommend buying BAR, the gold ETP I hold in my personal accounts. For those who prefer brand names, especially those wishing to stick with the SPDR family, GLDM is a practically identical alternative with an expense ratio just 1 basis point higher. I find it hard to justify recommending to pay 8 basis points more to buy and hold IAU and impossible to recommend paying 23 basis points more to buy GLD. All four have more than $1 billion AUM and trade at an average spread of one penny according to ETF.com. Therefore, exit liquidity should not be an issue.
The diversification benefits of gold GLD when the equity market goes into free fall through an ETP such as BAR, IAU or GLDM are tempered by two unfortunate realities. The first is the capital gains tax treatment mentioned above. The second shortcoming is that gold does not pay a dividend so there is no dividend income stream derived from the ETP that holds it. Another method to access a gold-like return stream that some investors use is to buy an ETF that holds a portfolio of the stocks of gold mining companies. iShares has the ETF with the highest AUM, with ticker symbol RING. RING does have a higher expense ratio, 0.39% rather than 0.25%.
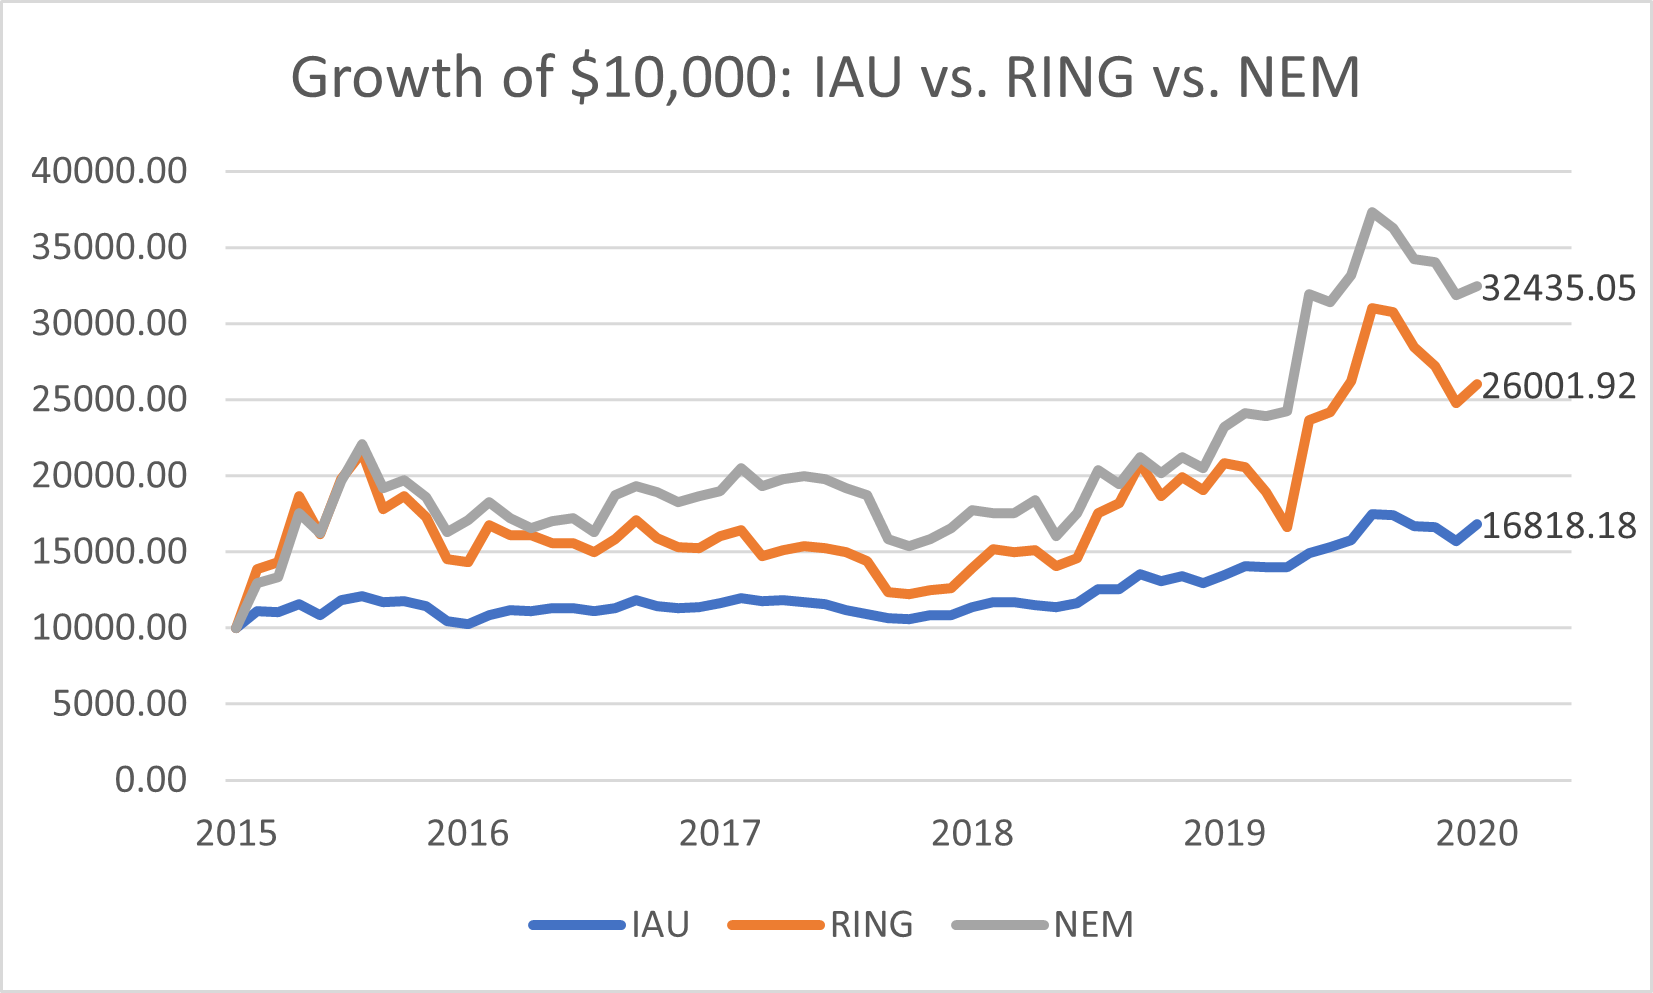
Has RING delivered gold-like returns the past five years and does it pay a dividend? The answer is that the returns of RING have been superior while following a remarkably similar pattern. Comparing RING with IAU for the period ending December 31, 2021, the one-year NAV return was 23.99% as compared with 16.90% for IAU. The analogous 5-year NAV returns were 23.58% and 8.77% respectively. Additionally, RING pays a yield that at year end was 0.75%. That is hardly a robust income stream but it is better than zero.
Free Two Week Trial to all 5,000 equities and 500 ETFs covered by ValuEngine HERE
Let’s look at this other alternative, Newmont Corporation (NEM). The largest holding in RING (nearly 20%) is NEM. Indeed, from the time I started in the industry until the launch and subsequent acceptance of GLD and other ETPs to access gold bullion, NEM was the most frequent stock bought to access exposure to gold. During the same 5-year period NEM had a price appreciation of 25.3% accompanied by a 2.4% yield. As to tracking, the correlations between GLD, RING and NEM during this period ranged from 0.94 to 0.96. This is very close tracking for three different ETFs. This chart reflects the growth of $10,000 invested in all three between December 31, 2015 and December 31, 2020. It also reflects the fact that RING was more volatile during this period than IAU, and NEM was more volatile than RING. So during this period, an investor would have improved both capital appreciation and income considerably by simply buying Newmont in lieu of IAU.
However, volatility cuts both ways. If it sometimes pays off to own a more volatile security when the precious metal is rising in price, it follows that it is probable that the fall of NEM may be greater if a subsequent downturn occurs. That’s precisely what has happened in the first quarter for the stock. It has dropped nearly 10% since year end. Pulling its ValuEngine report, we can see that Newmont’s annualized volatility is nearly 30%. It gets 3 Vs from ValuEngine, an average rating, for its current outlook even though its 3-year expected return is negative. It should also be noted that during gold’s five-year bear market from 2011-2015, Newmont’s price had fallen more than 20%.
Once again, timing is everything in the market. NEM and RING tracked IAU closely for the past 5 years but that has not been true of all 5-year periods in the past. Still for those seeking income, NEM provides a tempting alternative to IAU and BAR. I will also note guardedly that another method of deriving income from IAU is to sell IAU call options known as a covered call strategy and considered more conservative than a traditional long holding. However, IAU options are thinly traded and the timing of the rolls can be tricky. If you or your financial advisor is expert at options strategies, this may be worth exploring. If not, then consider the above three options for diversifying your equity holdings.
By Herb Blank
All of the approximately 5,000 stocks, 16 sector groups, and 140 industries have been updated on www.ValuEngine.com.
New: Over 500 ETF reports updated weekly.
Financial Advisory Services based on ValuEngine research available through ValuEngine Capital Management, LLC
Free Two Week Trial to all 5,000 plus equities covered by ValuEngine HERE
Subscribers log in HERE
_____________________________________________________________________________________________
support@ValuEngine.com | ValuEngine, Inc | (321) 325-0519