For today’s bulletin, we present key metrics for the top picks in the NASDAQ 100. The companies listed below represent the top-ten BUY stocks within the index. Western Digital $WDC is our new NASDAQ leader.
VALUATION WATCH: Overvalued stocks now make up 64.78% of our stocks assigned a valuation and 27.32% of those equities are calculated to be overvalued by 20% or more. Fourteen sectors are calculated to be overvalued.
ValuEngine tracks more than 7000 US equities, ADRs, and foreign stock which trade on US exchanges as well as @1000 Canadian equities. When EPS estimates are available for a given equity, our model calculates a level of mispricing or valuation percentage for that equity based on earnings estimates and what the stock should be worth if the market were totally rational and efficient–an academic exercise to be sure, but one which allows for useful comparisons between equities, sectors, and industries. Using our Valuation Model, we can currently assign a VE valuation calculation to more than 2800 stocks in our US Universe.
We also use trading data to provide forecast estimates for a variety of time horizons for almost ever equity in our database. Our Buy/Sell/Hold recommendations are based upon the 1-year forecast return figure. Using valuation and forecast figures, you can rank and rate our covered stocks against each other, to find out, in an objective and systematic way, the most attractive investment targets based on your own risk/reward parameters. We re-calculate the entire database every trading day, so you are assured that every proprietary valuation and forecast datapoint is as up-to-date as possible.
We can use our data to track individual stocks, industries, sectors, and indices. For today’s bulletin, we present key metrics for the top picks in the NASDAQ 100. The companies listed below represent the top-ten BUY or STRONG BUY stocks within the index. They are presented below according to their one-month forecast target prices.
Since we last reported on the NASDAQ back in January, we find a NASDAQ top-ten list with turnover of 40%. Our new leader, Western Digital (WDC) is joined by Liberty Ventures in second place (LVNTA), Seagate Technology (STX) in fifth, and Skyworks Solutions (SWKS) in seventh place.
Our newcomers displaced LAM Research (LRCX) and Applied Materials (AMAT)–our prior leader–from the top of the list and also forced American Airlines (AAL) and Broadcom (AVGO) down several spots as well.
Netease (NTES) and Cisco Systems (CSCO) maintained their positions despite all the newcomers. Not a single company from our last survey managed to move up in position.
Paccar Inc (PCAR), Qualcomm (QCOM), CA Technologies (CA), and CSX Corp (CSX) have fallen out of our NASDAQ top ten.
Note too, all of these companies are BUY-rated. There are no STRONG BUY stocks in our NASDAQ top-ten list
|
Ticker
|
Company Name
|
Market Price
|
Valuation
|
Last 12-M Retrn
|
1-M Forecast Retn
|
1-Yr Forecast Retn
|
P/E Ratio
|
Sector
|
1-5-2016 Leaders
|
|
WDC
|
WESTERN DIGITAL
|
77.08
|
12.43%
|
83.92%
|
1.05%
|
12.56%
|
14.40
|
Computer and Technology
|
AMAT
|
|
LVNTA
|
LIBERTY VENTR-A
|
43.55
|
-16.80%
|
31.61%
|
1.03%
|
12.34%
|
9.27
|
Retail-Wholesale
|
LRCX
|
|
LRCX
|
LAM RESEARCH
|
115.87
|
11.36%
|
75.35%
|
0.96%
|
11.55%
|
15.48
|
Computer and Technology
|
AAL
|
|
AMAT
|
APPLD MATLS INC
|
35.6
|
24.43%
|
119.89%
|
0.93%
|
11.14%
|
16.48
|
Computer and Technology
|
PCAR
|
|
STX
|
SEAGATE TECH
|
45.8
|
15.47%
|
50.86%
|
0.89%
|
10.69%
|
12.89
|
Computer and Technology
|
QCOM
|
|
NTES
|
NETEASE INC
|
265.52
|
10.76%
|
99.44%
|
0.77%
|
9.26%
|
20.25
|
Computer and Technology
|
NTES
|
|
SWKS
|
SKYWORKS SOLUTN
|
91.69
|
4.09%
|
54.62%
|
0.75%
|
9.03%
|
17.41
|
Computer and Technology
|
CA
|
|
AAL
|
AMER AIRLINES
|
45.06
|
20.39%
|
26.75%
|
0.70%
|
8.35%
|
6.93
|
Transportation
|
AVGO
|
|
CSCO
|
CISCO SYSTEMS
|
31.27
|
6.21%
|
36.37%
|
0.68%
|
8.14%
|
14.68
|
Computer and Technology
|
CSCO
|
|
AVGO
|
BROADCOM LTD
|
206.89
|
13.97%
|
69.78%
|
0.65%
|
7.76%
|
19.48
|
Computer and Technology
|
CSX
|
NOTE: New stocks are in BOLD, old stocks that have moved up the list are in GREEN, old stocks that have declined in position are in RED, and stocks which have retained their position are in CAPS.
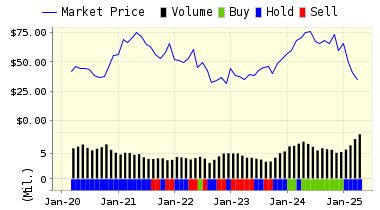
Below is today’s data on Western Digital (WDC):
Western Digital Corp. (WDC) designs, develops, manufactures and markets a broad line of hard drives featuring leading-edge technology. The company’s hard drives are designed for the desktop PC market and the high-end hard drive market and, recently, for the emerging market for hard drives specially designed for audio-visual applications, such as new video recording devices. The company sells its products worldwide to computer manufacturers for inclusion in their computer systems or subsystems and to distributors, resellers and retailers.
VALUENGINE RECOMMENDATION: ValuEngine continues its BUY recommendation on WESTERN DIGITAL for 2017-02-08. Based on the information we have gathered and our resulting research, we feel that WESTERN DIGITAL has the probability to OUTPERFORM average market performance for the next year. The company exhibits ATTRACTIVE Company Size and Momentum.
You can download a free copy of detailed report on Western Digital (WDC) from the link below.
|
ValuEngine Forecast
|
||
|
Target
Price* |
Expected
Return |
|
|---|---|---|
|
1-Month
|
77.89 | 1.05% |
|
3-Month
|
78.82 | 2.26% |
|
6-Month
|
81.21 | 5.36% |
|
1-Year
|
86.76 | 12.56% |
|
2-Year
|
82.12 | 6.54% |
|
3-Year
|
86.41 | 12.11% |
|
Valuation & Rankings
|
|||
|
Valuation
|
12.43% overvalued
|
Valuation Rank(?)
|
|
|
1-M Forecast Return
|
1.05%
|
1-M Forecast Return Rank
|
|
|
12-M Return
|
83.92%
|
Momentum Rank(?)
|
|
|
Sharpe Ratio
|
0.43
|
Sharpe Ratio Rank(?)
|
|
|
5-Y Avg Annual Return
|
15.71%
|
5-Y Avg Annual Rtn Rank
|
|
|
Volatility
|
36.19%
|
Volatility Rank(?)
|
|
|
Expected EPS Growth
|
53.86%
|
EPS Growth Rank(?)
|
|
|
Market Cap (billions)
|
17.90
|
Size Rank
|
|
|
Trailing P/E Ratio
|
14.40
|
Trailing P/E Rank(?)
|
|
|
Forward P/E Ratio
|
9.36
|
Forward P/E Ratio Rank
|
|
|
PEG Ratio
|
0.27
|
PEG Ratio Rank
|
|
|
Price/Sales
|
1.12
|
Price/Sales Rank(?)
|
|
|
Market/Book
|
1.67
|
Market/Book Rank(?)
|
|
|
Beta
|
1.56
|
Beta Rank
|
|
|
Alpha
|
0.26
|
Alpha Rank
|
|

DOWNLOAD A FREE SAMPLE OF OUR WESTERN DIGITAL (WDC) REPORT BY CLICKING HERE
ValuEngine Market Overview
|
Summary of VE Stock Universe
|
|
|
Stocks Undervalued
|
35.22%
|
|
Stocks Overvalued
|
64.78%
|
|
Stocks Undervalued by 20%
|
14.39%
|
|
Stocks Overvalued by 20%
|
27.32%
|
ValuEngine Sector Overview
|
Sector
|
Change
|
MTD
|
YTD
|
Valuation
|
Last 12-MReturn
|
P/E Ratio
|
| -0.34% | -0.30% | 2.53% | 18.25% overvalued | 38.33% | 24.27 | |
| 0.03% | -0.04% | 2.84% | 15.82% overvalued | 30.90% | 19.63 | |
| -0.15% | 0.49% | 1.77% | 13.88% overvalued | 27.51% | 18.32 | |
| 0.24% | 0.38% | 4.89% | 12.68% overvalued | 33.19% | 30.50 | |
| -0.13% | -1.07% | 1.11% | 11.36% overvalued | 19.92% | 22.73 | |
| -0.55% | -0.36% | 1.97% | 11.07% overvalued | 35.49% | 20.00 | |
| -0.28% | -0.92% | 0.39% | 10.37% overvalued | 23.16% | 23.31 | |
| 0.35% | 1.77% | 10.05% | 9.42% overvalued | 84.91% | 28.14 | |
| -0.01% | 0.86% | 2.39% | 7.96% overvalued | 21.65% | 24.46 | |
| -0.15% | -1.70% | 2.89% | 7.63% overvalued | 31.23% | 19.66 | |
| 0.36% | 2.47% | 4.97% | 6.78% overvalued | 46.08% | 14.51 | |
| -0.68% | -1.24% | 1.30% | 5.49% overvalued | 48.78% | 28.46 | |
| 0.13% | 1.39% | 3.25% | 5.44% overvalued | 48.11% | 20.71 | |
| -0.03% | -0.72% | 0.89% | 4.43% overvalued | 26.23% | 24.07 | |
| 0.75% | 0.43% | -0.96% | 0.52% undervalued | 13.91% | 23.11 | |
| -0.20% | 1.06% | 5.26% | 2.41% undervalued | 14.62% | 27.71 |