Despite expectations for weak-to-negative returns in 2024 because of an anticipated recession that never happened, 2024 has been a very strong year for the market and its major benchmark ETFs. The S&P 500 has been in a relentless uptrend since rebounding from the lows of the bear market of 2022. The Nasdaq-100 has been even more resilient. For the better part of five years, the top 7 stocks in Nasdaq and the S&P 500 have driven the market and left non-cap-weighted, broader-cap and small cap indexes in the dust. That order is still prevailing year-to-date.
All 5,000 stocks, 16 sector groups, 140 industries, and 500 ETFs have been updated:
Two-week free trial: www.ValuEngine.com
The third quarter, however, has provided a glimmer of a sea change. The category index ETFs showed a noteworthy reversal between July 1 and September 30 of this year, albeit not nearly enough to change the year-to-date order.
Morningstar summed it up this way:
“ For a while this summer, it looked like the bull market in stocks was in trouble. But by the end of the third quarter, stocks were back to posting new record highs…While the broad stock market goes into the final months of 2024 having resumed its rally, under the surface, the returns look fairly different. During the quarter, it appears that there was a rotation out of the big tech names that had led this bull market during the past five years.”
These positions were used as sources of funds to purchase stocks with smaller market cap sizes and less overpriced as measured by conventional metrics.
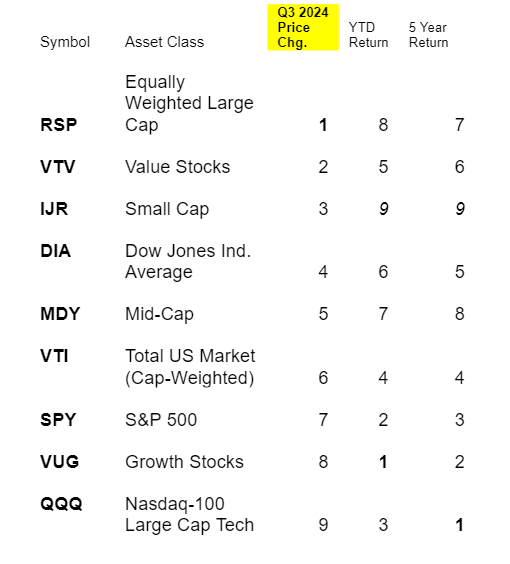
In the third quarter, the best performers were small-and mid-cap stocks along with value stocks. The laggards for so long became the leaders last quarter. The graph below displays the dramatic change in relative order of highest returns among the nine ETF categories for the past three months.
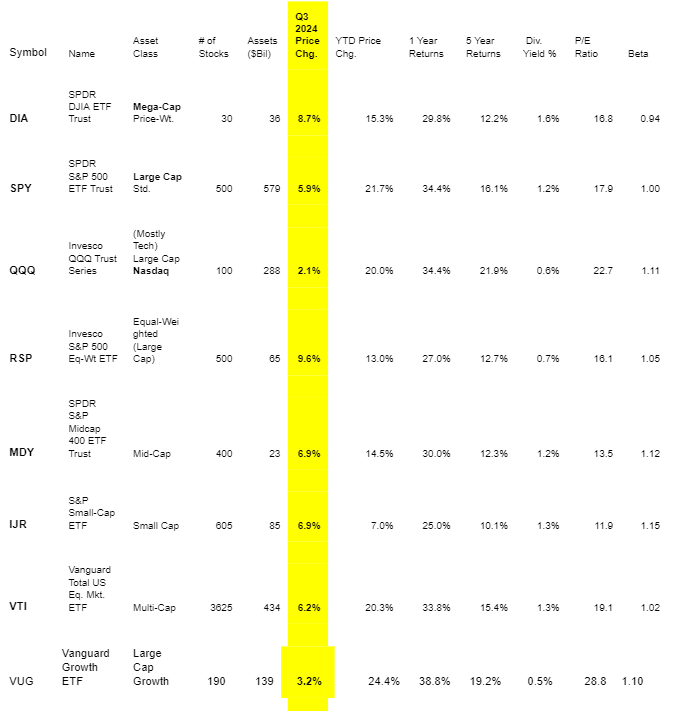
The table below compares ETFs for the most commonly cited equity asset classes categories.
Current ValuEngine reports on all covered stocks and ETFS can be viewed HERE

The year-to-date returns posted by all these ETFs were quite robust. In fact, each one outpaced inflation for its period by a wide-margin which is one of the principal reasons why investors and retirees are urged to hold equities.
This Table shows how the relative positions of returns for the nine asset category index funds shifted from the year-to-date and for the 5-year period.

Current ValuEngine reports on all covered stocks and ETFS can be viewed HERE
So, in the third quarter, RSP (the equally weighted S&P 500 ETF) garnered the top return but still posted the second-from-the bottom gain year-to-date and was third worst for the 5-year period. The Vanguard Value Equity ETF, VTV, rose from the middle of the pack in the two longer periods to finish second in the quarter. Meanwhile, IJR, representing small cap, has been so out of favor for so long that it finished dead last in the 5-year period and is still last year-to-date despite finishing third in the most recent quarter.
On the other end of the spectrum, QQQ, the Nasdaq-100 ETF Trust, went from first for the 5-year period to worst for the last quarter. Likewise, the Vanguard Growth Equity ETF, VUG, finished next-to-last this quarter despite being the top performer year-to-date thus far and being second only to QQQ for the 5-year period.
This table, courtesy of Nasdaq, focuses on the FTSE Russell Indices and clearly shows that both small- and large-cap value, as well as small-cap growth, meaningfully outperformed large-cap growth. The Russell 1000 contains the largest 1000 US-domiciled and traded stocks while the 2000 consists of stocks 1001 through the 3000th largest stock as ranked by float-adjusted market value. These two indexes are further decomposed into growth and value using a combination of fundamental ratios and growth calculations.
So, now the question is whether this past quarter’s new trends will continue or will big tech come roaring back and outpace everything? Of course, it is also possible that this past quarter’s re-allocation to smaller cap stocks and stocks with lower valuation ratios could be a sign that the market is finally nearing that top that strategists have been predicting all year. In that case, small cap and value stocks might outperform simply by sinking less rapidly than ETFs such as QQQ, SPY and VUG.
The following table is identical to the earlier one highlighting the 3rd quarter vs. two other time periods with one key indicator added – the ValuEngine Predictive Rating driven by our proprietary model.
Current ValuEngine reports on all covered stocks and ETFS can be viewed HERE
| Symbol | Asset Class | VE Rating | Q3 2024 Price Chg. | YTD Return | 5 Year Return |
| RSP | Equally Weighted Large Cap | 4 | 1 | 8 | 7 |
| VTV | Value Stocks | 3 | 2 | 5 | 6 |
| IJR | Small Cap | 4 | 3 | 9 | 9 |
| DIA | Dow Jones Ind. Average | 3 | 4 | 6 | 5 |
| MDY | Mid-Cap | 3 | 5 | 7 | 8 |
| VTI | Total US Market (Cap-Weighted) | 3 | 6 | 4 | 4 |
| SPY | S&P 500 | 2 | 7 | 2 | 3 |
| VUG | Growth Stocks | 2 | 8 | 1 | 2 |
| QQQ | Nasdaq-100 Large Cap Tech | 2 | 9 | 3 | 1 |
Financial Advisory Services based on ValuEngine research available: www.ValuEngineCapital.com
ValuEngine rates relative one-month-to-one-year-ahead performance on a scale from 1 (Strong Sell) to 2 (Sell) to 3 (Hold) to 4 (Buy) to 5 (Strong Buy) with the majority of ETFs being ranked 3 (Hold). Indeed, there are only two ETFs ranked as 4 (Buy). They are IJR, the Small Cap ETF and RSP, the equally weighted S&P 500. Three ETFs are rated 2 (Sell). They are all the former leaders that underperformed last quarter after outperforming for five years. These include: QQQ, VUG and SPY. This illustrates that our predictive model does not consider the shifts out of large cap growth into other market segment categories to be a fluke but part of a continuing trend. More ominous is the fact that all three are projected for negative price returns during the next 12 months. It is often said that the stocks that lead the market up eventually tend to also lead the market back down. According to our model, this outcome is a distinct possibility.
______________________________________________________________
By Herbert Blank
Senior Quantitative Analyst, ValuEngine Inc
www.ValuEngine.com
support@ValuEngine.com
All of the over 5,000 stocks, 16 sector groups, over 250 industries, and 600 ETFs have been updated on www.ValuEngine.com
Financial Advisory Services based on ValuEngine research available through ValuEngine Capital Management, LLC
Free Two-Week Trial to all 5,000 plus equities covered by ValuEngine HERE
Subscribers log in HERE
