2022 provided a litmus test for ETFs designed to shield Investors from the full impact of a major stock market decline. The bad news is that half of them failed. The good news is that three of them actually did perform in line with their objectives.
These are the results of a recent study that I co-authored with Dr. Eugene O. Yeboah and Richard Greene from Global Finesse. It has been published in Academia.edu. The link is: https://www.academia.edu/100976306/Downside_Mitigation_ETFs.
All 5,000 stocks, 16 sector groups, 140 industries, and 500 ETFs have been updated.
Two week free trial: www.ValuEngine.com
Downside Mitigation ETFs are also popularly called Defined Outcome ETFs, Buffered ETFs, and Risk-Managed ETFs. The fact that historical returns from the US stock market have been positive for most ten-year periods since the depression is one reason that asset allocators and retirement strategists generally recommend that investors less than 50 years of age invest at least 70% of savings earmarked for retirement into the stock market. However, that advice provides little comfort for investors with limited downside cushions and shorter time horizons for preserving their nest eggs. Often the solution prescribed for such investors is to reduce the percentage invested in equities and transfer it to bonds. Often, they are told in their sixties to ratchet the allocation down to 50%-50% and down to 40%-60% once they reach 75. The reason is that there have historically been a number of three-year periods with as much as a 50% decline in a three-year period. This would leave many retirees without sufficient time or savings to allow their money to bounce back.
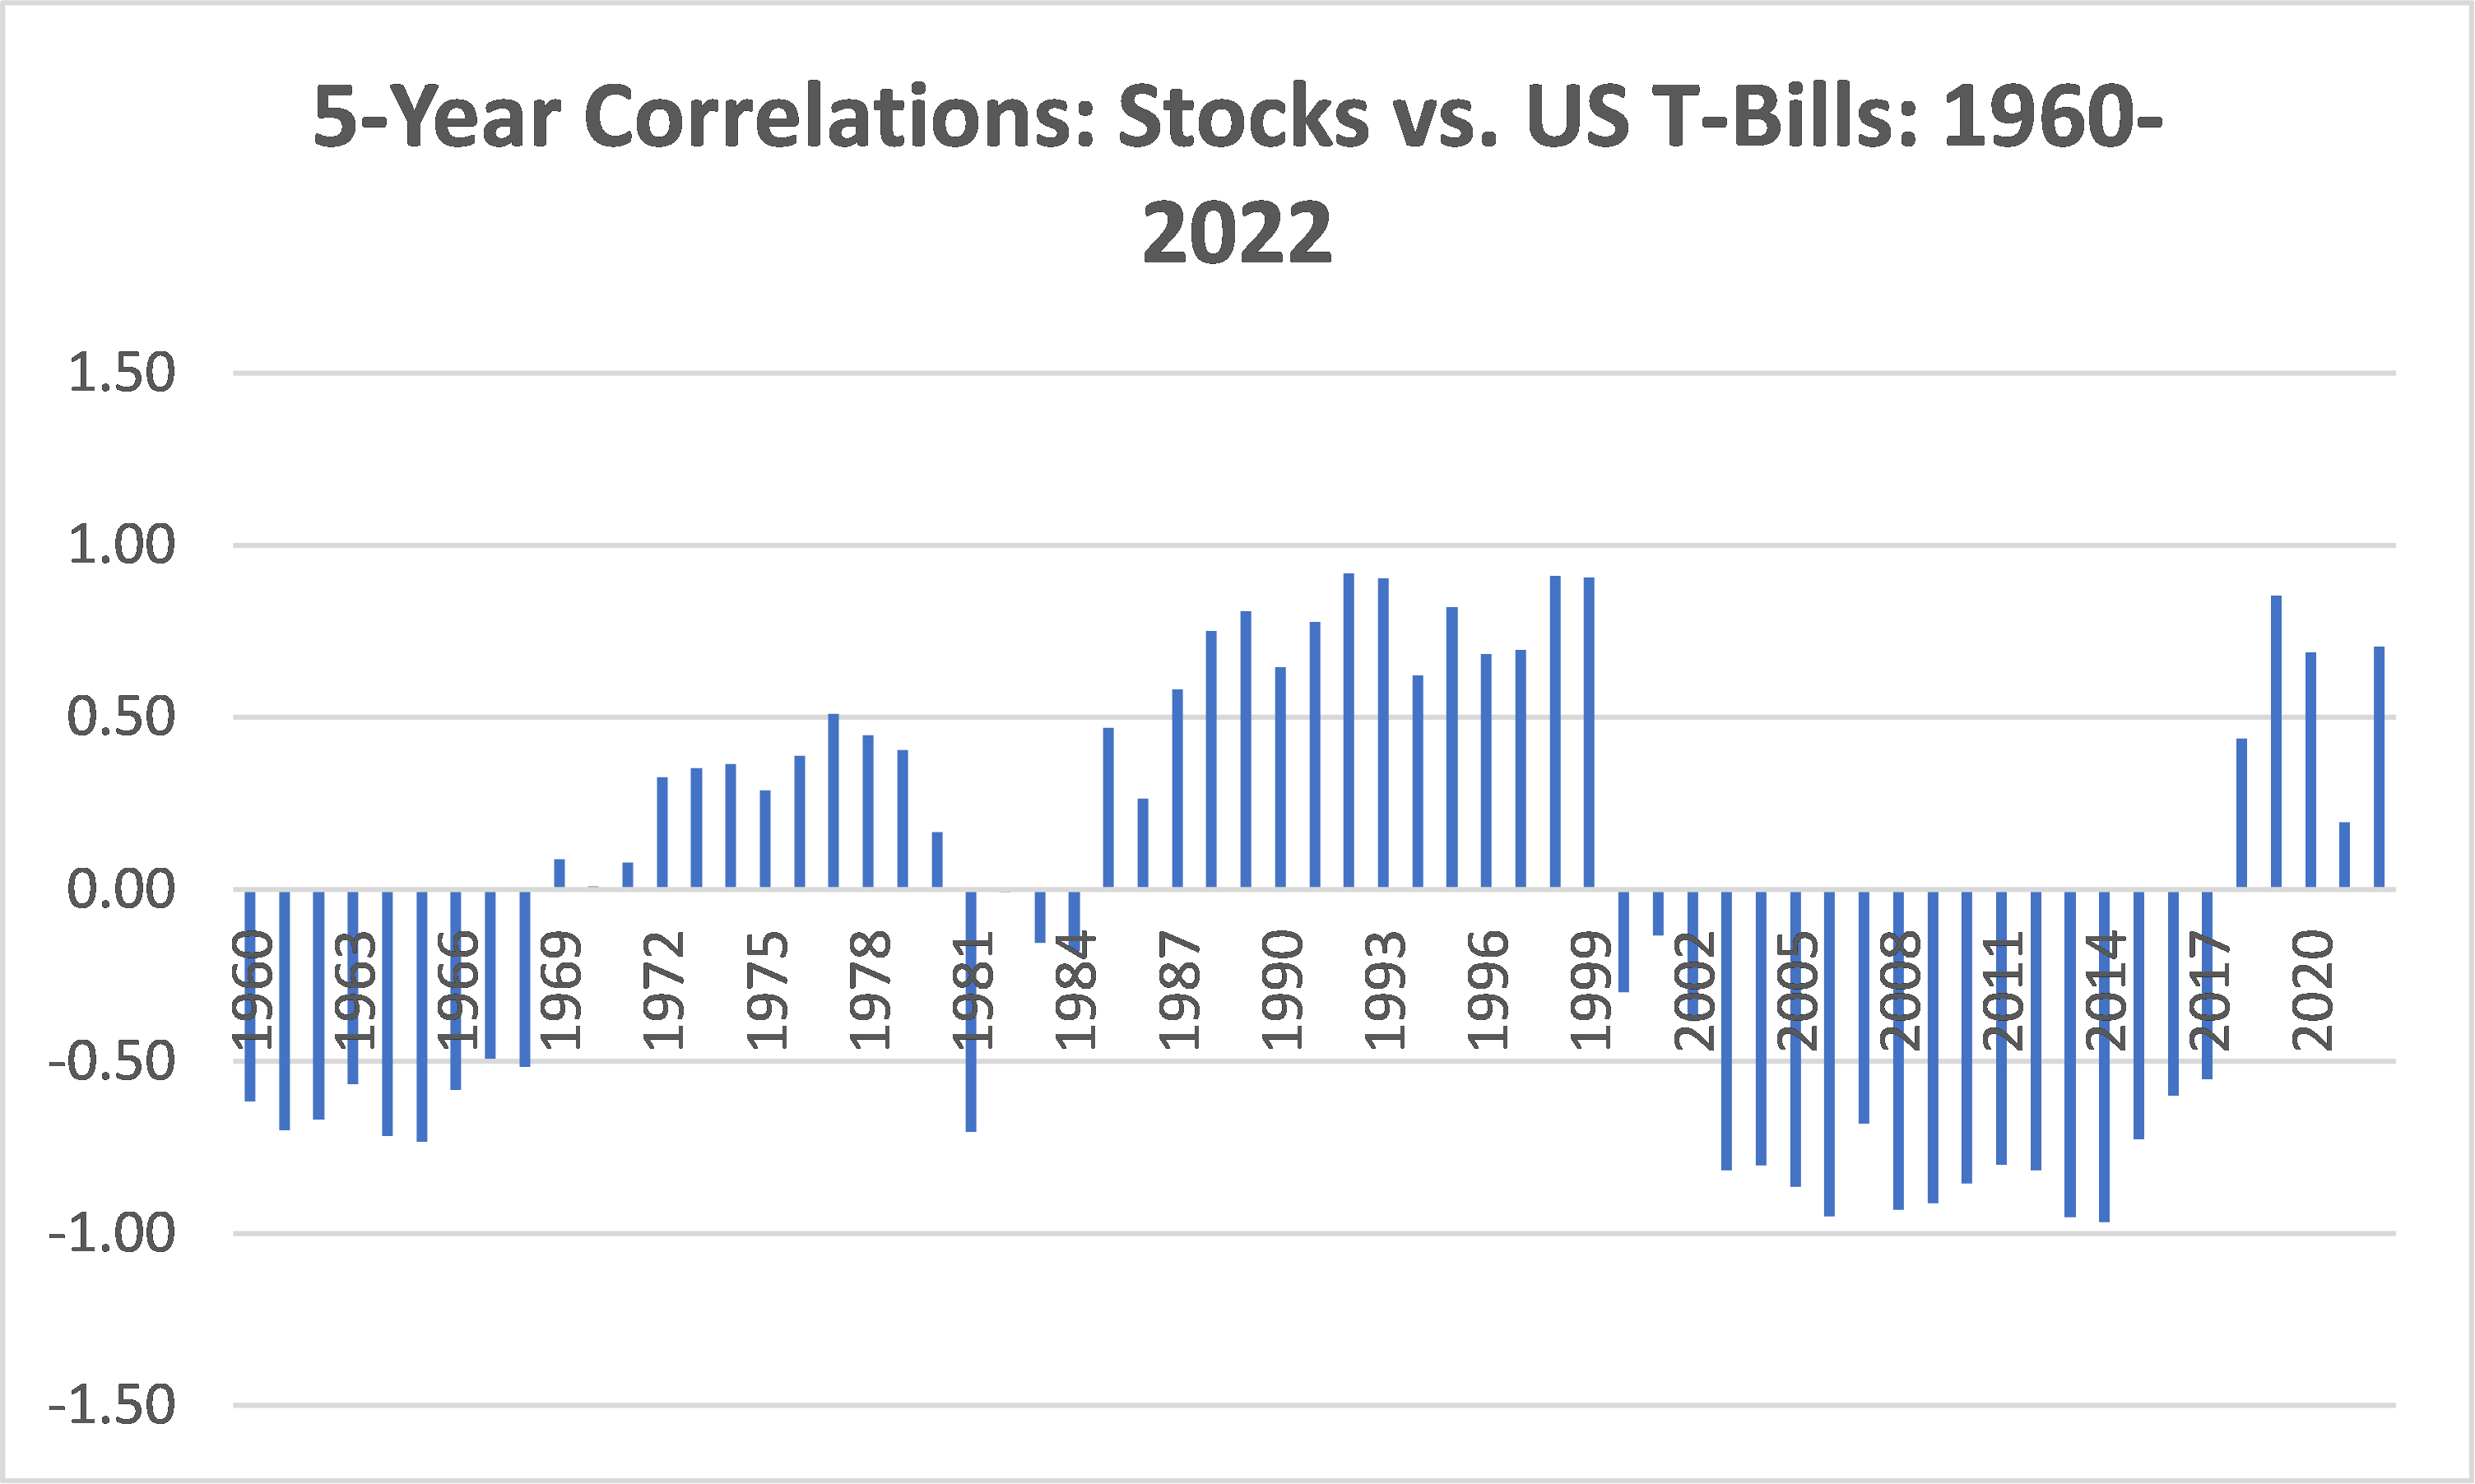
The problem is that investments in bonds also have downside risk. However, market professionals generally think of bond returns as being inversely correlated with stock returns. In actuality, stock index returns and bond index returns have been positively correlated in more than half of the years from 1970 through 2022. See the chart below.
Downside mitigation ETFs were introduced to address these realities. They are designed to achieve equity returns with a fraction of the risk. There are more than 160 ETFs in the Downside Mitigation category that are listed on US exchanges. They are provided by eight ETF sponsors that run the gamut from newly-entered specialty providers to established and prolific ETF Sponsors, including the following: Amplify; ASYMmetric; Cambria: Evoke Aris; Global X; Innovator; Invesco; Nationwide; and Simplify. Invesco offers one of the broadest selection of ETFs in the industry. Global X also has more than 100 ETFs and is well-known for offering niche products for different types of investors. Nationwide is an insurance-focused long time fund manager that entered the ETF market nearly 10 years ago. Cambria was one of the earlier families of ETFs to use fully transparent active management along with strategies that use derivatives. ASYMmetric, Evoke Aris, Innovator and Simplify all have less than five years in the market place and were created specifically to offer products that fit into the Downside Mitigation category.
It is one of the newer companies that has become dominant in both the number of products and assets under management thus far, Innovator ETFs. A major reason they have so many is that each of their funds is managed for a particular month-beginning and month-ending 12-month period. Accordingly, they have 12 funds for each of their seven Defined outcome series meeting a variety of return, risk and income objectives using asset classes ranging beyond large cap US equities. Innovator refers to their family as Defined Outcome ETFs. The first three of these debuted in August of 2018. That said, an influx of new competitors entered the market in 2022 with more expected in 2023.
To frame the competitive landscape for conservative investors most concerned with losses while understanding the need to maintain some growth, the study selected the ETFs in each provider’s offerings to the most conservative of the US large market capitalization strategies they offer. These descriptions have been abridged from the more thorough explanations in the research report.
The eight ETFs included in the study were:
Current ValuEngine reports on these stocks or ETFS can be viewed HERE
ASPY, ASYMmetric Smart S&P 500 ETF is an indexed and rules-based strategy designed to deliver S&P 500 returns with a fraction of the risk over a full market cycle. The fund seeks to produce these results by dynamically reducing portfolio risk or exposure as S&P 500 risk increases. The strategy aims to provide protection against bear market losses, by being net short, and to capture the majority of bull market gains, by being net long, with respect to exposure to the S&P 500® Index.
BJAN, Innovator U.S. Equity Buffer ETF, is an actively managed fund that uses options in an effort to moderate losses on the S&P 500 over a one-year period starting each January. The fund foregoes some upside return as well as the S&P 500’s dividend component because the options are written on the price (not total) return version of the index. The fund is actively managed, resets annually, and uses listed options exclusively. Innovator has 11 clone funds: BFEB, BMAR, BAPR, etc. to accommodate investors who want to invest on the first day of other months.
NUSI, Nationwide Nasdaq-100 Risk-Managed Income ETF, is an actively managed portfolio of stocks that are among those included in the Nasdaq-100 Index and an options collar. Per index rules, the fund only invests in the top 100 largest by market cap, nonfinancial stocks listed on NASDAQ. A collar strategy involves selling or writing call options and buying put options, thus generating income to hedge some downside risk. The fund’s manager utilizes a proprietary, systematic model to manage the Fund’s options positions. The strategy seeks to generate high current income on a monthly basis while managing downside risks.
PHDG, Invesco S&P 500 Downside Hedged ETF, is an actively managed ETF that offers exposure to S&P 500 stocks with a big difference. The fund aims to stave off the impact of huge market downturns by holding a substantial position in VIX futures. The downside is that maintaining VIX futures exposure over time is expensive. This ETF will likely outperform when the market tanks but consistently lag when markets behave more normally. PHDG is one of the oldest funds in this category having debuted in 2012.
RPAR, the Risk Parity ETF is actively managed yet nonetheless aims to align its exposure to an index, the Advanced Research Risk Parity Index. Risk parity is a strategy that seeks multi-asset class diversification to ensure good performance in virtually any macroeconomic environment. In order to approximate this strategy, the index is diversified across four asset classes: TIPS; US Treasury Bonds; global equities; and commodities. It seeks returns similar to global equities with lower standard deviation over time.
SPD, the Simplify US Equity PLUS Downside Convexity ETF owns S&P 500 ETFs but can have up to 20% of its portfolio in put options as warranted by market conditions according to its decision rules. SPD aims to deliver simple convexity without the complexity of buffered ETFs. The fund is actively managed and seeks capital appreciation by investing the bulk of portfolio assets in ETFs providing exposure to the S&P 500 Index combined with a modest allocation in a put option overlay.
SWAN, the Amplify Black Swan ETF, is designed to participate in 30% of S&P 500 returns by holding laddered 10-Year Treasury Bonds and using the income to purchase long-dated call options on the S&P 500. SWAN aims to provide muted equity exposure while mitigating downside risk. The fund gets its equity exposure via long-dated options (LEAPS) on SPY, the mega-ETF tracking the S&P 500.
TAIL, the Cambria Tail Risk ETF, is an actively managed fund that holds mostly cash and treasuries while using the strategy of buying put options on the S&P 500 with the purpose of portfolio downside protection.
2022 represented the sharpest annual decline suffered by the S&P 500 Index since the financial crisis in 2008. Virtually all negative factors that could potentially worry investors, in what began the year as a grossly overvalued market by historical standards, were in action. These include:
- the huge spike in energy prices fueled by Russia’s war in the Ukraine;
- general geopolitical unrest aggravating supply chain issues;
- greater-than-anticipated spikes in inflation;
- negative earnings guidance and reports by some of America’s largest companies;
- inflation “sticker shock” had consumers reduce discretionary purchases;
- fears of recession and not to miss the cyclical earnings season;
- a hawkish Fed raising rates;
- The steepest inversion of the yield curve in the past 50 years;
- declining GDP numbers confirming a technical recession and
- anticipated tax and spending increases.
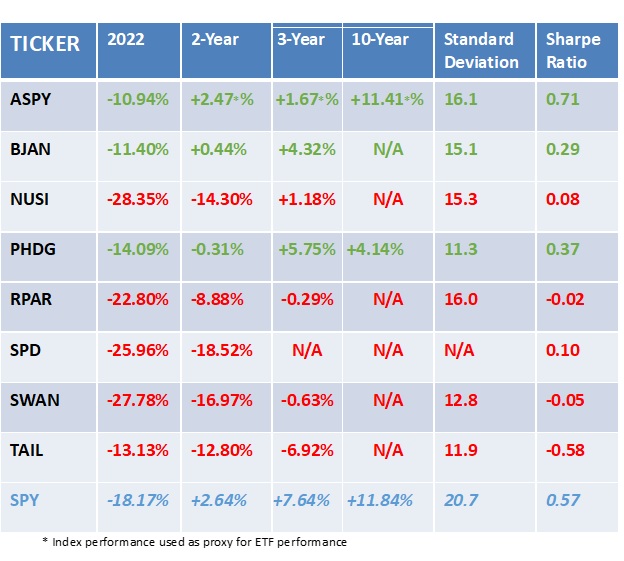
Amidst all this turmoil, SPY, the S&P 500 ETF Trust suffered a loss of 18.17% in calendar year 2022. Investors were forewarned that Downside Mitigation ETFs would underperform in strongly positive years for the stock market. However, they had every right to expect substantially less of a drawdown than SPY in a year such as 2022. This chart provides calendar year 2022 price changes alongside multiple-year return periods for each of the eight ETFs in the study.
Current ValuEngine reports on these stocks or ETFS can be viewed HERE
Current ValuEngine reports on these stocks or ETFS can be viewed HERE
Analyzing the returns for the eight ETFs and comparing them with SPY, it is evident that some of the ETFs did not protect their investors from full participation in the downturn. In fact, four of the ETFs actually lost substantially more than the S&P 500 in 2022. These include: NUSI; RPAR; SPD and SWAN. All four failed the test as defined by their objective functions. A fifth, TAIL, saved owners 25% of SPY’s total drawdown in 2022- 13 5 as compared with -18%. On the other hand, it performed so poorly in 2021, a double-digit loss in a year that SPY gained more than 28%, that its two-year annualized return was more than 1000 basis points (10.16%) worse than SPY. Investors expect to sacrifice upside so that even 5% to 10% would be acceptable in a year that SPY posted superior returns. A double-digit loss in a positive year, exactly what investors in TAIL wanted to avoid, is unacceptable. Thus, TAIL failed the combined 2021-2022 test. This leaves ASPY, BJAN and PHDG as the only three ETFs in the group that gave investors what they expected: downside risk mitigation when the markets did poorly. That is why the table above shows ASPY, BJAN and PHDG in green while the five failed ETFs are shown in red. For comparison SPY, representing the benchmark, is shown in blue.
Comparing the three ETFs that passed the test, ASPY did the best job in the study both in 2022 and on a two-year basis including 2021 and 2022. It had the lowest drawdown in 2022 and the two-year return was the closest of the downside mitigation to that of SPY.
On a three-year basis, the results tell a different story, BJAN and PHDG outperformed market-signal-reliant ASPY as the March Covid-related plummet followed by the bull market that prevailed during the remainder of 2020 shifted technical signals back and forth. For the volatile three-year period, PHDG performed best, returning 5.75% in comparison to 4.32% for BJAN and just 1.67% for ASPY.
Looking at the long-term, only two of the ETFs in the study provide 10-years of results: ASPY and PHDG. For the long-term period, the index used for ASPY shows it to be an all-weather strategy, returning an annualized 11.41%. This is just 43 basis points less than the 11.84% returned by the S&P 500 with a much lower standard deviation. As a result ASPY has a superior Sharpe Ratio for the 10-year period to SPY, 0.71 as compared with 0.57. For those with shorter time horizons who have avoiding drawdowns as #1 priority with limited participation on the upside, the options-collar strategy pursued by PHDG is worthy of consideration, It had the lowest standard deviation of any of the eight strategies. However, with an annualized return of just 4.1%, PHDG only captured 35% of SPY’s upside for the 10-year period while ASPY secured a 96% capture ratio for the same period. Since BJAN is actively managed, there was no index available to include it for the 10-year comparisons. Nevertheless, on the basis of comparisons since inception, BJAN deserves consideration alongside ASPY and PHDG as Downside Mitigation ETFs for conservative investors that actually provide downside protection during major market downturns.
Why did the other five ETFs, NUSI, RPAR, SPD, SWAN and TAIL, fail to provide protection when it was needed most? Scrutiny of the methodology of all five of these ETFs reveals the fact that 10-Year or 30-Year T-Bills are used as a “safe haven” within the strategy. Confronted with an environment where T-Bill ETFs and mutual funds posted double digit losses, the strategies failed. None of the five fund disciplines took into account that while government securities have no credit and/or quality risk, long-term T-Bills have quite a bit of duration risk in a rapidly rising interest rate environment.
This leaves just three reasonable choices from the eight ETFs in the study for Downside Mitigation: ASPY, BJAN, PHDG. For investors looking to preserve the long-term upside that an investor would expect from SPY that also provides dependable downside risk mitigation, ASPY rates a slight edge over BJAN. This is with the caveat that results will depend on the time period measured. For example, in the three year period including 2020, PHDG would have been the best place to be. However, as we have seen, its tight collar limits participation on the upside.
A glance at the peripherals associated with ETFs reveals that the tightest average trading spread belongs to BJAN with 0.23%. ASPY is just a bit wide at 0.28% while the spread on PHDG is 0.38%. PHDG is by far the least expensive of the three as compared with 0.79% for BJAN and 0.95% for ASPY.
In terms of investing with dollar average contributions on a bi-weekly basis, logistics get somewhat complicated with BJAN. It is only for Investors who put money in the fund during January that management can make best efforts to cut off annual losses at 9%. It is recommended that February contributions go to BFEB and March contributions go to BMAR, etc. Having 12 ETFs rather than 1 as the US core equity option in the portfolio could get to be a bit more complicated than some investors would prefer. From that perspective, ASPY is the best and simplest all-weather alternative for owning the market and mitigating downside risk, while ultra-conservative investors who do not wish to trade in and out of funds should find solace with PHDG.
Financial Advisory Services based on ValuEngine research available: www.ValuEngineCapital.com
SUMMARY
Whether one uses the label “Defined Outcome”, “All-Weather” or “Risk Managed”, the objective of ETFs using these labels is always mitigating the downside drawdowns of capital. Hence, this report defines ETFs in this category as Downside Mitigation ETFs. Eight such ETFs, no more than one from any sponsor, were selected for the study. The concept implies that these are ETFs that will protect investors when the market posts double-digit negative returns. 2022 was the perfect test for such ETFs. Unfortunately for their investors, five of the eight ETFs in the study failed that test. NUSI, RPAR, SPD and SWAN all had methodologies that included long positions in US Treasury Bonds as safe harbors albeit within differently formulated strategies. With most long Treasury bond funds going down double digits while the stock market was doing the same, this became a double whammy. The result is that all four of these ETFs had returns of -22.8% or lower. The range was between 400 and 1000 basis points of underperformance when the SPY returned -18.2%.
The bottom line is that investors believed they were trading upside participation for downside protection and did not get the latter. All four failed the 2022 test. TAIL, actively managed with allocations to several alternative asset classes, did manage to post a 2022 return that was less negative than that of SPY. But its return in 2021 was so abysmal that for the two-year period of 2021 and 2022 it was down 1000 basis points more than SPY.
The positive news is that three ETFs passed the test, ASPY, BJAN and PHDG. ASPY performed best in the 1- and 2-year periods ending December 31, 2022, while PHDG and BJAN both fared better in the three-year period. BJAN, the January ETF in a series that has one for every calendar month, also performed well in a strong 2019 for SPY. Since BJAN did not exist in 2018 and it is actively managed, we have no information on how it would have performed during that down year or in the six mostly positive years that preceded it. Potentially, the ASPY performance might be a reasonable indication.
For the long-term view, 10-year return histories were only available for ASPY’s index and PHDG to compare with SPY. PHDG performed exactly as expected for investors that put downside protection above full participation in upside returns. It had the lowest price volatility and kept drawdowns at a minimum while capturing 35% of the returns realized by SPY. For long-term investors looking for a core long-term holding, ASPY’s hybrid performance was outstanding. Its standard deviation was considerably less than that of the S&P while capturing 96% of SPY’s return. The differential was a mere 43 basis points. As a result, ASPY finished the 10-year period with a Sharpe Ratio, a measure of return-per-unit-risk, of 0.71 as compared with 0.57 for SPY, a substantive difference.
Investors seeking ETFs that mitigate losses when the markets tank but still provide upside participation is to make sure that the “safe assets” that the risk-managed strategies depend upon have little-to-no duration risk. That was a major ingredient of the success for the three ETFs, ASPY, BJAN and PHDG. These three funds met their objectives well when investors needed them most.
_______________________________________________________________________________
By Herbert Blank
Senior Quantitative Analyst, ValuEngine Inc
www.ValuEngine.com
support@ValuEngine.com
All of the approximately 5,000 stocks, 16 sector groups, 140 industries, and 600 ETFs have been updated on www.ValuEngine.com
Financial Advisory Services based on ValuEngine research available through ValuEngine Capital Management, LLC
Free Two Week Trial to all 5,000 plus equities covered by ValuEngine HERE
Subscribers log in HERE