| For today’s bulletin, we take a look at our latest historical market valuation calculations.
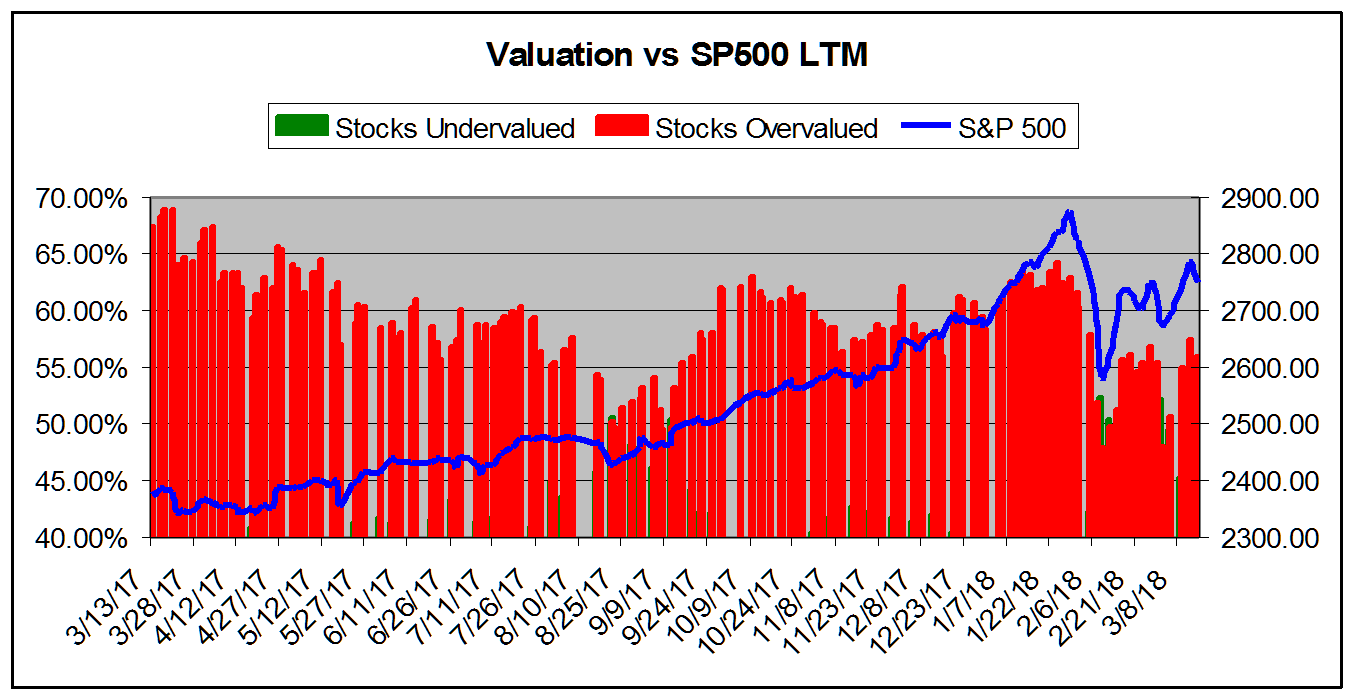
VALUATION WATCH: Overvalued stocks now make up 56.07% of our stocks assigned a valuation and 21.35% of those equities are calculated to be overvalued by 20% or more. Thirteen sectors are calculated to be overvalued. ValuEngine tracks more than 5000 US equities, ADRs, and foreign stocks which trade on US exchanges as well as @1000 Canadian equities. When EPS estimates are available for a given equity, our model calculates a level of mispricing or valuation percentage for that equity based on earnings estimates and what the stock should be worth if the market were totally rational and efficient–an academic exercise to be sure, but one which allows for useful comparisons between equities, sectors, and industries. Using our Valuation Model, we can currently assign a VE valuation calculation to more than 2800 stocks in our US Universe. We combine all of the equities with a valuation calculation to track overall market valuation figures and use them as a metric for making calls about the state of the market. Two factors can lower these figures– a market pullback, or a significant rise in EPS estimates. Vice-versa, a significant rally or reduction in EPS can raise the figure. Whenever we see overvaluation levels in excess of @ 65% for the overall universe and/or 27% for the overvalued by 20% or more categories, we issue a Valuation Warning. When the levels exceed 60%, we issue a Valuation Watch We now calculate that 56.07% of the stocks to which we can assign a valuation are overvalued and 21.35% of those stocks are overvalued by 20% or more. These numbers have increased slightly compared to what we saw when we published our last valuation study in August, 2017. At that time, we saw an overvaluation figure of 52.16%. This means that currently the market is within “normal” range. We finally fell below the critical 60% threshold required for an Valuation Watch near the end of July 2017. Figures remained normal throughout August and most of September. Then, we re-issued a Valuation Watch from September 28th-October 31st. Once the market began to climb again after the election of Donald J. Trump, valuations grew briefly overheated and necessitated another Valuation Watch for a few days at the end of November and beginning of December– and then once more at the end of December and throughout January and early February, 2018. Since we called off our last Valuation Watch on February 5th, the market has seen some volatility return thanks to Trump’s erratic policy pronouncements on issues such as trade and tariffs, the Russia investigation, tensions with North Korea, etc. But–while it does tend to creep up whenever the market manages to recover and put in a bit of a leg up–our valuation data has remained within “normal” range, . Currently, the numbers do not indicate that the market is overheated and things have stabilized as the the earnings picture has improved and share prices appear more reasonable to our models. Of course, when it comes to US foreign policy and Trump, peace and negotiations are better for stocks than bluster and war. We have seen this over-and-over as investors get spooked by some incident demonstrating unhinged behavior at the White House only to recover once the ensuing walk back occurs. Domestically, one cannot help but think that Trump occupies an ever-shrinking patch of ground, with Mueller appearing to be closing in on the “big fish” with every new subpoena and indictment. Would impeachment be plus or a minus for stocks? One can imagine that the initial shock would cause damage, but perhaps we could see a “relief rally” as well as investors witnessed a return to steady direction and “normalcy” in DC. Regardless of which side you find yourself on when it comes to the occupant of 1600 Pennsylvania Avenue, as always we caution readers to leave their political predilections out of their portfolios and their decision-making processes–and beware of pundits who base their calls and analyses on their own. We do however find that replacing a Gary Cohn with a Larry Kudlow as Trump’s primary economic advisor will be a negative given Kudlow’s long and well-documented record of being wrong about almost everything when it comes to the markets and policy–seriously, google it, the internet has already provided numerous accounts of some of Kudlow’s more ridiculous calls and predictions. Trump is running out of bodies up there, and it is becoming more-and-more difficult for the administration to find people who have not spoken out against him–and thus meet the criteria for “loyalty” in Trump world–who are also respected in their positions, competent for the higher roles, AND willing to work in a White House in a constant state of crisis and chaos. As this situation plays out, one hopes that the US can avoid any true crises of either a foreign or domestic nature as the White House becomes more isolated and increasingly unable to attract top-notch talent. Claims about hiring only “the best people” ring ever-more hollow when one takes a look at the White House organizational chart these days. Is this an episode of “The Apprentice”? Or perhaps “Survivor”? These concerns aside, overall we retain a positive outlook for stocks in the short term. We believe the remarkable bull market that began under he Obama Administration has a bit more to go. But, longer term we believe that the massive Trump/GOP tax cuts combined with higher interest rates and government borrowing–have you checked the deficit figures lately?–will lead to trouble down the road just as the 80s Reagan “miracle” begat Bush the Elder’s 90s recession. Nothing lasts forever–and we have seen this sort of scenario before. We note too that while we have seen some wage growth lately, it is not enough to allow workers to finally regain all the lost ground of the past few decades. We believe that tax cut benefits garnered by large corporations will go to executive pay and bonuses and share buy-back programs. Bonuses to workers are short-term PR ploys or benefits already negotiated by unions in many cases. Any permanent wage increases will probably be negated before they have a chance to spread. We fully expect the Fed to remove the so-called “punch bowl” well before workers can enjoy the kind of wage increases necessary to restore balance to our system. If you throw a trade war into this mix, with its particular dangers to the nation that has benefited most from the current world order–at least at the top levels of society–we become even less sanguine about the future. We remind readers that “autarky”– the system which existed prior to WWII where great nations raised trade barriers and sought their own isolated markets, self-sufficiency, and independence– was NOT a stabilizing force and led to conflict and destruction. Indeed, much of the post-war world order was created by the US in the ashes of WWII precisely to bind nations together through open trade so that all could compete, rebuild, and defeat communism. Of course, this was also of great benefit to the US and its own economy. The Bannon wing of the GOP– and Trump himself –seem to forget this history as they tear up international trade agreements and proclaim trade wars “easy.” They also damage US credibility when they make blatantly untrue statements about various trade balances and then try to lie about their factual inaccuracies in order to make them appear correct after the fact. Numbers don’t lie! Negotiations must be based in reality and from a position of trust. At some point we believe there will be irreparable harm done to the US and its reputation if the current path becomes the norm. In any case, let’s take a look at our historical valuation data once again. Below, we present our valuation figures for the various time frames we track in our historical studies. You can draw your own conclusions about recent history, recent administrations, and the markets from this data. The chart below tracks the valuation metrics from March 2017. It shows levels in excess of 40%. Here you can see our recent-past Valuation Watches and Warnings–when the red bars exceeded 60% and 65%.
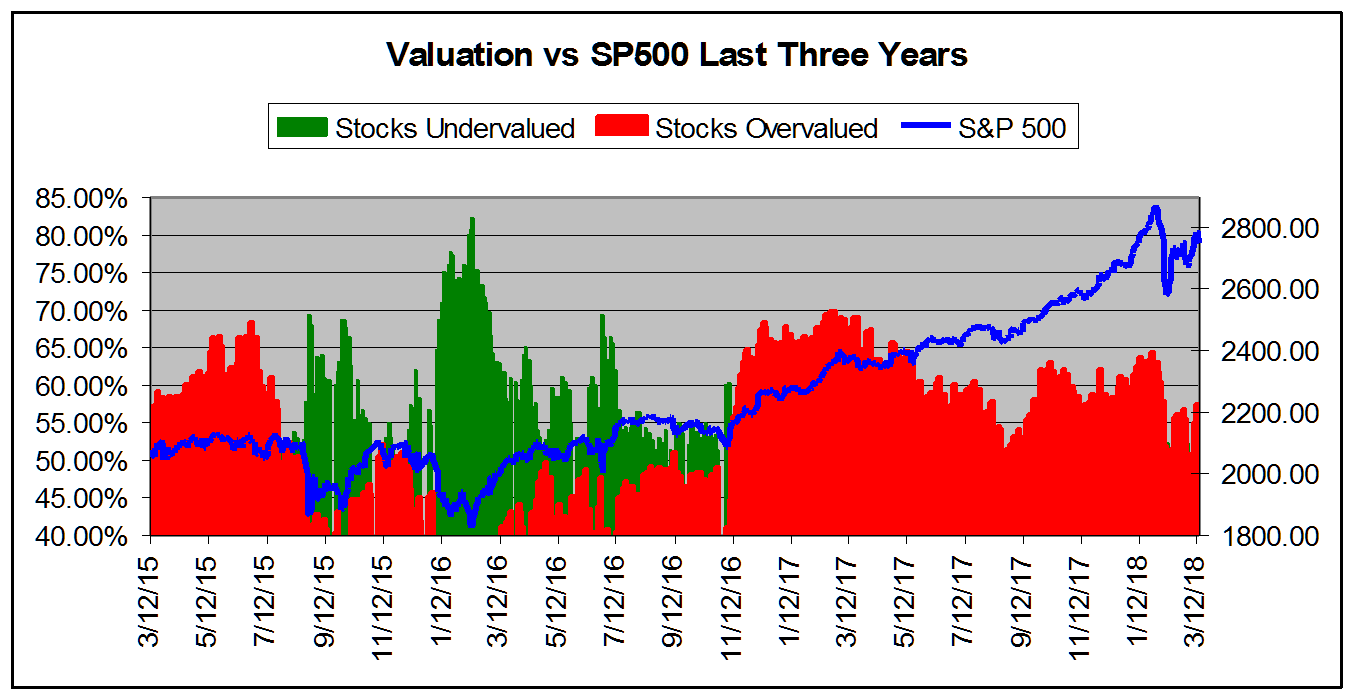
This chart shows overall universe over valuation in excess of 40% vs the S&P 500 from March 2015. Here we see that the last really long-term buying opportunity signal occurred back in early 2016. The undervalued condition has not really held sway since then. Note also that while share prices are up, the overvaluation figures have declined because the models calculate that the higher share prices are justified by earnings.
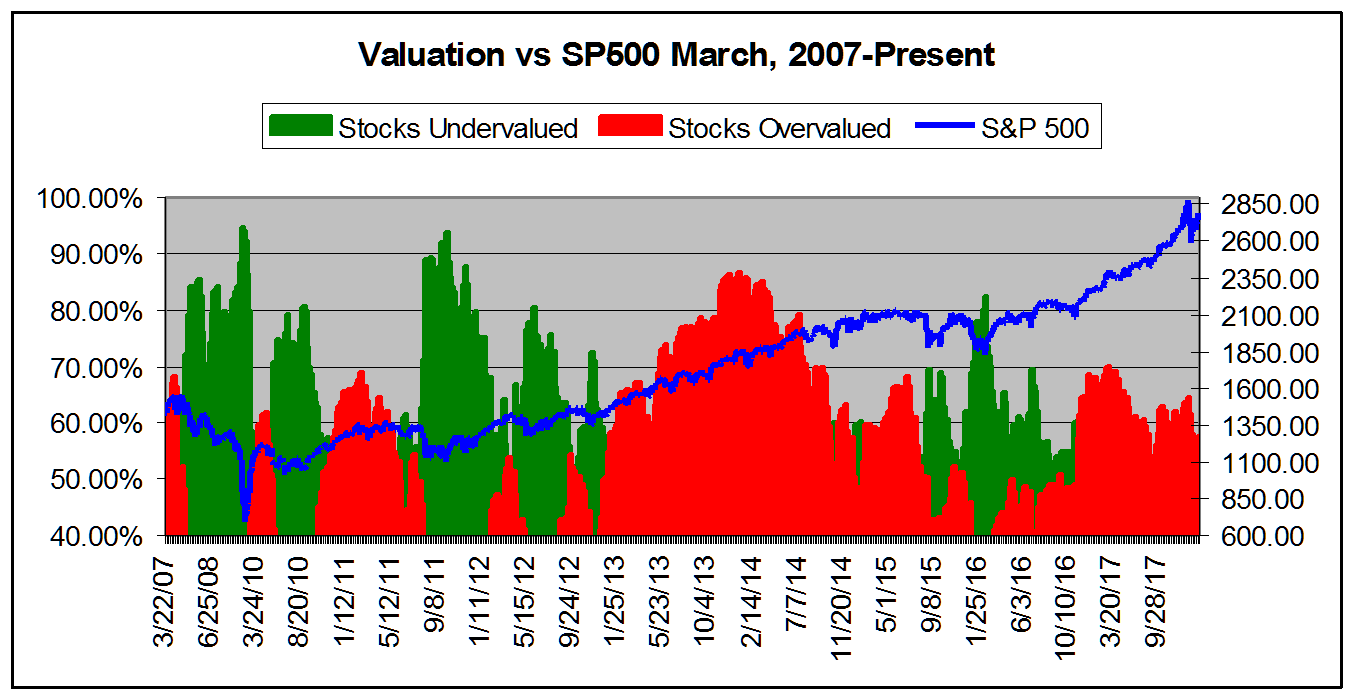
This chart shows overall universe under and over valuation in excess of 40% vs the S&P 500 from March 2007.* Look at that growth since the markets bottomed out after Bush the Younger’s financial collapse and Great Recession. We’ve come so far since that “devilish” 666 inter day SP500 low of March 9, 2008! Notice too that the long-term chart put the so-called “Trump rally” in its proper context. We’ve been on a bull run most of the time since that low. You’d be hard pressed to figure out when the Obama administration gave way to Trump without the date labels on the X-axis. The trend line has been pretty consistent since 2009.
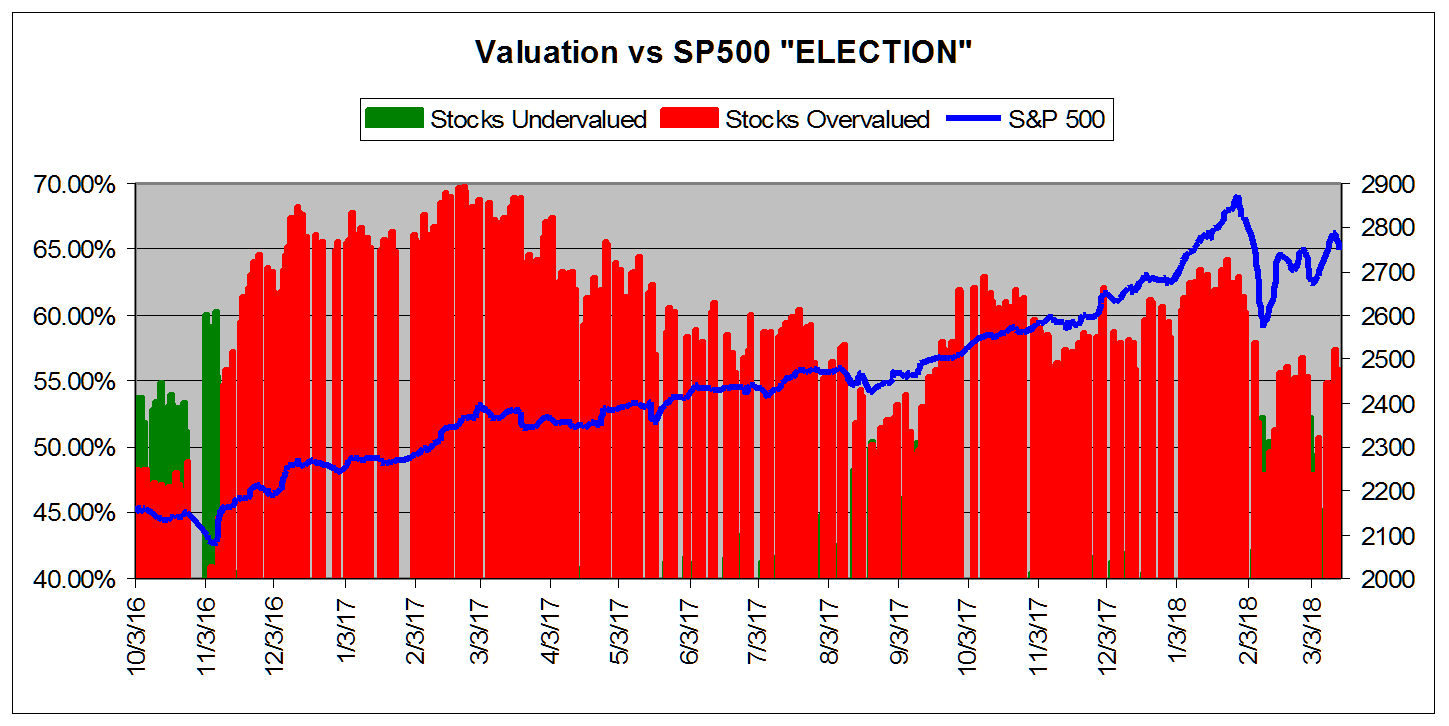
*NOTE: Time Scale Compressed Prior to 2011. Finally, this chart shows the market from October 2016-present. We use this one to evaluate the so-called “Trump rally” for the markets. Again, a nice leg up–but that dip at the beginning of February sure raised some doubts for this particular vein of Trump triumphalism!
ValuEngine.com is an Independent Research Provider (IRP), producing buy/hold/sell recommendations, target price, and valuations on over 5,000 US and Canadian equities every trading day. ValuEngine Capital Management LLC is a Registered Investment Advisory (RIA) firm that trades client accounts using ValuEngine’s award-winning stock research.
|
 |