Weekly Market Recap – Week Ending Jun 26, 2026
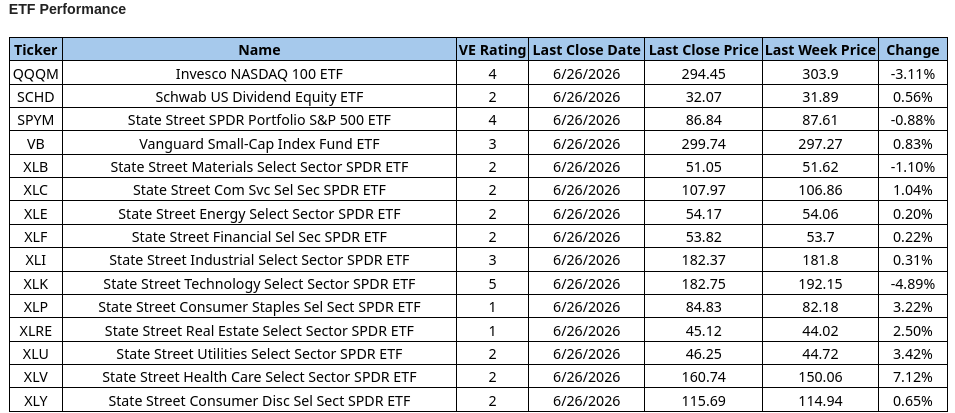
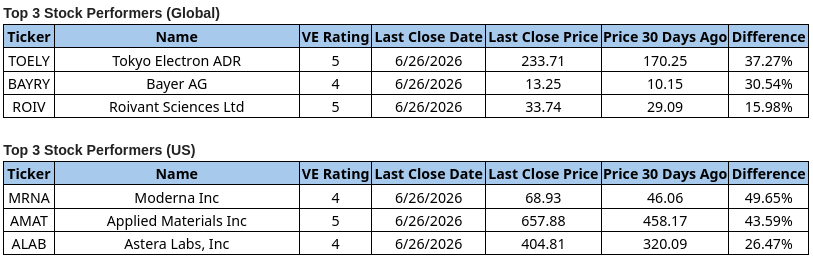
U.S. equity markets were mixed this week, with weakness in growth and technology offset by strength in defensive and health care sectors. The NASDAQ 100 ETF (QQQM) declined 3.11%, while the S&P 500 ETF (SPYM) slipped 0.88%, pressured by a sharp pullback in Technology (XLK), which fell 4.89%. In contrast, Health Care (XLV) led the ETF group with a strong 7.12% gain, followed by Utilities (XLU), Consumer Staples (XLP), and Real Estate (XLRE), indicating a rotation toward more defensive areas of the market. Stock-specific momentum remained notable, with Moderna (MRNA), Applied Materials (AMAT), Tokyo Electron (TOELF), Bayer (BAYRY), Astera Labs (ALAB), and Roivant Sciences (ROIV) posting strong 30-day gains, highlighting continued strength across selected health care, semiconductor equipment, and life sciences names.
Trade ValuEngine supported portfolio strategies, www.ValuEngineCapital.com
Free Trial: Direct Access to ValuEngine Research on over 5,000 stocks and 700 ETFs HERE
As early as the end of May, this column stated that it was highly probable that June, the third worst performing calendar month in general, would follow its historical midterm election-year pattern of negative S&P 500 Index and ETF performance, especially when following a strong month of May. As noted by Jeff Hirsch, Editor-In-Chief of Stock Traders Almanac, that trend, more often than not, turns positive again if the end of June falls on the week leading up July 4th. One popular explanation for those last days turning positive is “window-dressing” for the end of the second quarter for the midyear reports. Although academics have cast doubts upon the existence of the “window-dressing” trading phenomenon in general, most Wall Street traders still seem to believe in it. What’s not debatable is that since 2000, July has been one of the three strongest months for stock market returns with an average return of 1.3%. In midterm election years during that same period (2002, 2006, 2010, 2014, 2018 and 2022), SPY, the StateStreet SPDR S&P 500 Index ETF Trust (SPY), has returned 1.2%. So, July has been the oasis in the midterm election year June through September desert.
Let’s put all this in the context of our usual disclaimer: there is no guarantee that these monthly calendar-based trends will continue. Nevertheless, the 2026 stock market as benchmarked by the S&P 500 index has hewed to the midterm election year monthly patterns on a relative basis thus far. Although no one knows if this will continue to hold going forward, let’s look a bit deeper at which sectors did best in this “rebound” month in midterm election years.
Not counting Communications (XLC) and Real Estate (XLRE), the two sectors that didn’t begin until 2018 and thus had only two midterm election data points, the top performing select sector SPDR in midterm months of July has been StateStreet Sector SPDR Select Health Care (XLV). The worst month in such years has been for the Utilities Sector SPDR (XLU); it is also the only sector that has an average negative price change in those months of -0.8%.
Looking at the Medical Sector for opportunities, we found 39 stocks with a market cap exceeding $10 billion that were rated 5 (Strong Buy) or 4 (Buy). Sorting by universe valuation ranks using ValuEngine’s proprietary valuation model, we found four stocks priced at more than $10/share that fit these criteria. They are: Illumina Inc (ILMA); Argenx ADR (ARGX); Charles River Lab (CRL); and Globus Medical (GMED). All four are rated 4 (Buy). The least overvalued stock rated with our best rating of 5 for future performance is BridgeBio Pharmaceutical (BBIO), just 2% overvalued, still in the top 42% of our universe for valuation since about 60% of our stocks are currently overvalued. Investors that follow our models may want to check out these five stocks from this screen as a starting point for due diligence before contemplating purchase.
We wish all of you a momentous week and a glorious semi-quincentennial American Independence Celebration!
www.ValuEngine.com (
www.ValuEngineCapital.com (
BLOG.VALUENGINE.COM for the full history of ValuEngine.com financial blog posts
____________________________________________________________________________
5,000 stocks, 600 ETFs, 16 sector groups, and 140 industries updated on www.ValuEngine.com
Full Two Week Free Trial HERE
Financial Advisory Services based on ValuEngine research and Portfolios available through www.ValuEngineCapital.com