U.S. equity markets entered the first trading days of the new year on a mixed footing, with weakness concentrated in mega-cap growth and technology while selective strength appeared across small caps, energy, and industrial sectors. Dividend-oriented and defensive exposures also showed relative resilience. The dispersion in sector and factor performance underscores an ongoing rotation theme that has periodically resurfaced since late 2025.
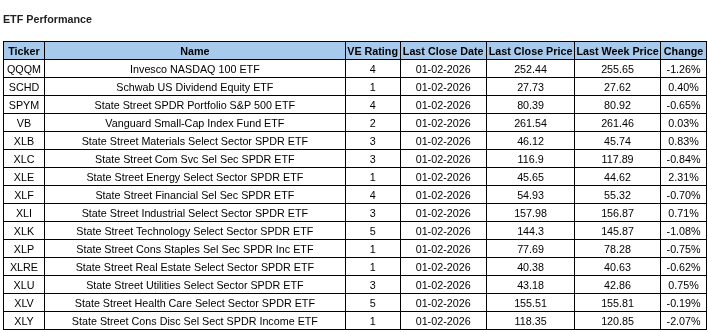
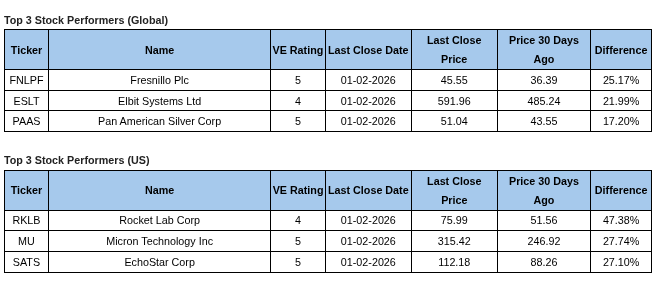
In the below tables we use major ETF’s as a proxy for some major indexes as well as each of the sector groups into which we divide the overall markets. Tracking these over time provides a more defined picture of the US markets than simply tracking major indexes. This is followed by notable individual stock movers over the past month, before presenting our full strategy outlook.
Free Trial: Research on over 5,000 stocks and 700 ETFs HERE
Current ValuEngine reports on all covered stocks and ETFs can be viewed HERE
Trade ValuEngine designed portfolio strategies, www.ValuEngineCapital.com
Strategy Note:
Those looking for the Santa Claus rally to last until the New Year were somewhat disappointed as the last three days of 2025 were all down a bit as measured by the S&P 500 and the Nasdaq-100, though nothing close to reducing the impact made by the upswing on the prior week. Certainly not all stocks were down last week. The small cap indexes were up a bit and signs of rotation away from mega-cap growth towards value stocks that we noted evidence of in the fourth quarter of 2025 were evident once again after the large cap rally of the previous two weeks.
Summarizing year-end ETF behavior before we can set strategy moving forward, the index ETFs we follow to represent US equity categories performed as follows in 2025. The digit in bold following the return is the index’s current ValuEngine predictive rating.
- SPYM, State Street SPDR Portfolio S&P 500 ETF, 17.8%, 4
- RSP, Invesco Equal Weight S&P 500 ETF, 11.2%, 2
- QQQM, Invesco QQQ Portfolio ETF, 20.8%, 4
- VUG, Vanguard Growth ETF, 19.4%, 4
- VTV, Vanguard Value ETF, 15.3%, 3
- MDY, SPDR S&P Midcap 400 ETF Trust, 7.2%, 3
- IWM, iShares Russell 2000 ETF, 12.7%, 2
Other asset class index ETFs we normally track in this column although unrated by ValuEngine are included below with their 2025 rates of return.
- EFA, iShares Core MSCI EAFE Developed Markets ETF, 32.1%
- EEM, iShares MSCI Emerging Markets ETF, 34.0%
- AGG, iShares Core U.S. Aggregate Bond ETF, 7.2%
- IAUM, iShares Gold Trust Micro ETF of Beneficial Interest, 64.3%
- SLV, iShares Silver Trust, 144.7%
Relative to their histories, this was a high-return year for all of these ETFs. As good a year as it was for stocks and bonds, it was an astronomic period for precious metals. While gold continued its superior returns to equities for the entire 21st Century, silver made up for lost time, more than doubling the return of gold. Non-US stocks outperformed US stocks by just under double as the US fell relative to the Euro and other major currencies.
In the US, it was another year of mega-cap domination but more in the first half of the year as differences narrowed a bit in the second half of the year with the small cap IWM bouncing back smartly from a negative first half of the year to approach 13% overall return. The same is true about growth versus value where a 2-to-1 margin turned into less than a 25% edge. The differences between cap-weighting versus equal weighted S&P 500 stocks didn’t narrow much showing that the S&P 500’s robust performance has a major concentration issue toward mega-cap technology leaders and remains a major factor in market returns.
What does all this mean for allocation decisions? Following this rise, all of the asset class indexed ETFs are priced at historical highs. However, high valuations have never caused a crash. They just tend to expand until a major bearish-fueling event occurs. If we had to pick one of these recent ETFs as overpriced, it would be SLV. If equity returns crater because of concerns of global instability causing economic distress, then IAUM or GLDM (its more liquid equivalent in State Street’s SPDR series) would be the more historically dependent way to proceed.
Whether 2025’s foreign stocks out-performance extends to 2026 will depend upon whether the dollar continues to weaken relative to other fiat currencies. We have no model for currencies but many large cap ADRs are rated 4 or 5 so opportunities still abound.
As far as US equities are concerned, our models still favor large- and mega-cap equities, specifically tech, health care and financial stocks. Select Sector SPDR ETFs XLK (Technology) and XLV (Health Care) are both top rated at the strong-buy level 5. The Financial Select Sector SPDR ETF XLF is just behind them at 4.
Top-rated individual stocks with reasonable valuations according to our valuation model include: Tenet Health (THC), Universal Health Services (UHS), Uber Technologies (UBER), Principal Financial Group (PFG) and Buenaventura Mining ADR (BVN), a Peruvian mining company.
The sector ETFs our model rates as strong sell (1) include the consumer sectors, XLP and XLY, and energy. However, the Venezuelan invasion and potential occupation could certainly affect future performance of energy stocks. Whether consumer stocks perk up will likely depend on the extent to which consumers are persuaded that inflation is under control.
One thing to keep in mind is that ValuEngine ratings are very dynamic and stocks rated Strong Buy or Strong Sell rarely keep that same rating throughout an entire year. The guidelines are for dynamic asset allocators who re-evaluate sector attractiveness at least quarterly while stock ratings, always meant as guidelines, are for active investors who are ready to trade on a daily or weekly basis as needed. They are useful for longer time periods primarily for smaller satellite positions, not for major allocations in buy-and-hold portfolios. ValuEngine has a fair market valuation model that is appropriate for buy and hold investors, but that is a discussion for another time.
Now the stage is set for 2026. We wish all our readers health, happiness and prosperity the whole year long.
www.ValuEngine.com (
www.ValuEngineCapital.com (
BLOG.VALUENGINE.COM for the full history of ValuEngine.com financial blog posts
____________________________________________________________________________
Existing subscribers alert: ValuEngine has launched a completely redesigned and new website! Please check it out at www.ValuEngine.com
Free trials available for new subscribers. Over 4,200 stocks and 600 ETFs covered.
Full Two Week Free Trial HERE
5,000 stocks, 600 ETFs, 16 sector groups, and 140 industries updated on www.ValuEngine.com.
Financial Advisory Services based on ValuEngine research available through www.ValuEngineCapital.com