In the wake of the Chinese Evergrande collapse, the S&P 500 shed more than 2% last Monday. Analysts speculated that Chinese real estate contagion might be especially detrimental to Apple, Google and Netflix, all purported to have huge exposures to China. In fact, two major investment banks issued predictions last week that the market would be down 20% during the nascent correction. Yet by the end of the week, the S&P 500 had bounced back nicely, recouping most of its losses.
Many market pundits and strategists have been stating authoritatively for quite a while that it is not a question of if the market will crash but when. The most common reason stated is that the S&P 500 Index is too heavily concentrated in recent winners, mostly tech companies. Concentration concerns are not unfounded. The top 5 holdings of the S&P 500 now comprise nearly 24% of the S&P 500 as compared with 11.5%. Moreover, technology stocks comprise 34% of its weight as compared with 9%.
Predictions of another tech bubble worse than the 2000 collapse are not uncommon. Given these reasons for anxiety, investors holding Nasdaq-100 have even more to fear. The Nasdaq-100 is much more concentrated with 41% of its weight in its top 5 holdings and 60% in the Technology sector.
The level of anxiety investors should feel should vary according to individual time horizons and liquidity needs. Even when the market has declined 40% or more, its resiliency eventually rises to the occasion and recoups the losses before climbing further. Armageddon predictions generally go unfulfilled. So, just “set it and forget it” works for investors that will not need to draw down holdings during the next 20 years. However, if your $10,000 became $6,000 and then you needed to liquidate holdings at that point in time, it doesn’t help you if the index eventually recouped those losses.
So let’s take a look at overall performance for SPY (the largest S&P 500 ETF) alongside QQQ (the oldest ETF based upon the Nasdaq-100). Since QQQ is often used by investment houses and reporters as a tech proxy, we’ve included a pure technology ETF, XLK – the S&P Select Sector SPDR Technology ETF – for comparison. Since QQQ was launched in March 1999, the analysis begins April 1, 1999.
This chart shows the growth of $10,000 invested in QQQ in the first full month following its inception in March 1999 in comparison with the pure-tech Select Sector SPDR technology XLK and SPY for the period from April 1, 1999 through September 17, 2021.
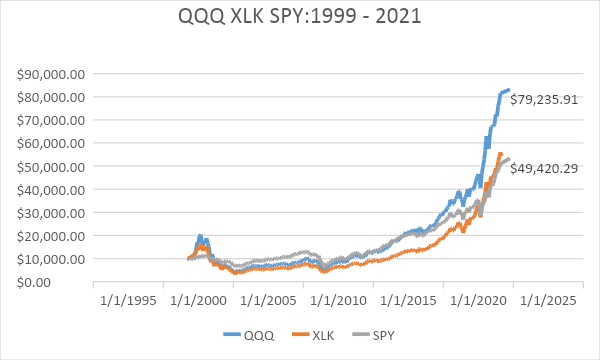
It’s obvious from this line graph that QQQ was a great investment for the full period. It grew the initial investment nearly eight times all the way to more than $79,000. The question is how many investors could afford to hold it or have the resolve to hold it the entire 22+-year period.
After investors came close to doubling their money in the first 12 months, the original $10,000 which had become $20,000 lost all that and much more. It went into free fall and hit its nadir of $3850 in September 2002. That’s more than a 60% drawdown in 3-1/2 years. My guess is that very few of the original QQQ investors had the resolve to hang in there expecting that it would eventually fulfill its initial promise of above-average growth. In fact, much more patience was needed before the steep payoff period began in earnest. The initial $10,000 investment in QQQ finally retrieved its initial value in September 2007. That recovery was short lived. QQQ then plunged below the $10,000 mark just three weeks later as the build-up to the financial crisis began. It’s fall from peak to trough during the financial crisis was 41%. It would take three more years until September 2010 for the investment to stay over its threshold level for good. That is 11.5 years after the initial investment was made. In contrast, the actual octupling of the QQQ investment took only 11 years to occur so far and it might have further to run before the inevitable bear market eventually occurs.
How does the history of SPY compare with QQQ? After plunging below $10,000 in February 2001, the lowest point for the SPY investment came in March 2003 just before the start of the second Gulf War. That low point of the hypothetical investment during its first five years was $6,667, precisely a 33% loss. Disappointing, but many had enough liquidity to be able to stay the course. SPY rewarded the buy-and-hold investors by crossing the threshold in July 2005. However, the financial crisis took an even greater toll. It fell from above $13,000 in October 2007 all the way down to its lowest point of the investment, just below $6500 in March 2009, a decline of more than 50% in 17 months.
The fact that SPY fell more than QQQ during the financial crisis can be attributed to the fact that tech-heavy QQQ has comparatively little financial sector exposure.
Since March 2009, both SPY and QQQ have stayed on an upward trajectory with just two hiccups of note. In the fourth quarter of 2018, both fell almost 11%. During the CoVid-19 market shock of 2020, both fell 29% from February 19 through March 16. Although both went on to have excellent years, the difference in magnitude is staggering. SPY’s return for calendar year 2020 was 16.2% in contrast to 42.6% for QQQ. XLK, the Select Sector SPDR Technology comprised of technology sector stocks in the S&P 500, came close to keeping pace with QQQ with a 38.4% meaning that most of the sector diversification within the S&P 500 was a drag on its performance last year. Underscoring that point, RSP, an Invesco ETF containing the S&P 500 stocks that is rebalanced quarterly to equally weighted positions, only produced a 10% return on the year. This demonstrates an investment truth. If your primary investment thesis proves true, diversification will lower portfolio returns in addition to its main purpose of reducing volatility. This brings us to XLK, even more undiversified from a sector perspective than QQQ. On a rolling basis, XLK equaled the impressive 10-year return of QQQ and had better returns for the past 5-, 3- and 1-year periods. However, XLK also fell even more than QQQ during the 2000-2 and 20007-9 declines. In fact, the hypothetical investment in XLK did not get back above the original $10,000 until October 2013, three years after QQQ did. Although XLK actually outperformed QQQ from that point through September 17, it had lost so much ground in the original 15 years that the hypothetical investment is worth $54,435, nearly $25,000 less than QQQ but $5,000 more than SPY. In the chart we use IVV as the indicator for the S&P500 index.
The following table provides more insights into the three ETFs.
| QQQ | XLK | IVV | |
| ValuEngine Rating | 4 | 4 | 3 |
| 1-Yr Forecast Return | -2.4% | -2.1% | -3.7% |
| 3-Mo. Historical Return | 11.1% | 11.0% | 6.3% |
| 1-Yr Historical Return | 38.5% | 38.9% | 33.0% |
| 3-Yr Historical Return | 28.1% | 29.8% | 17.3% |
| 5-Yr Historical Return | 27.4% | 29.0% | 17.9% |
| 10-Yr Historical Return | 22.2% | 22.2% | 16.5% |
| Volatility | 16.5% | 17.2% | 15.1% |
| Sharpe Ratio | 1.43 | 1.42 | 0.97 |
| # of Stocks | 100 | 77 | 500 |
| % Labeled
Undervalued by VE |
34% | 25% | 44% |
| % Weight in Top 5 Holdings | 41% | 52% | 24% |
| % Weight in Technology* | 60% | 87% | 34% |
| P/B Ratio | 8.9 | 11.1 | 4.5 |
| P/E Ratio | 33.9 | 33.9 | 25.3 |
| P/S Ratio | 5.7 | 7.5 | 3.2 |
| Div. Yield | 0.5% | 0.7% | 1.3% |
| Exp. Ratio | 0.20% | 0.12% | 0.03% |
| Index Provider | Nasdaq | S&P Dow Jones Indexes | S&P Dow Jones
Indexes |
| Index
Scheme |
Modified Mkt-Cap Weighted | Mkt-Cap Weighted | Mkt. Cap Weighted |
| ETF Sponsor | Invesco | SPDRs by SSgA | SPDRs by SSgA |
Salient observations we can make:
- The S&P 500 has been in an unprecedented 12.5 year bull market since March 2009. Price/Book, Price/Sales and Price/Earnings multiples are at or near their all-time highs. The dividend yield is just 1.3%, a post-WWII low. The tech sector now accounts for 34% of the S&P 500 and 24% of the index’s weight is concentrated in its top five holdings.
- All of these factors, especially record valuations, concentrated risks in the tech sector and the length of the bull market, have caused most market pundits and many financial advisors to urge investors to expect a potential correction.
- Specific advice has been to reduce core positions in market-cap weighted indexes, especially the S&P 500 and the Nasdaq 100. ETF investors are being warned to diversify out of SPY and QQQ into actively managed funds. Those investors that want to remain in indexed ETFs are recommended to sell SPY and QQQ in favor of NOBL, the Dividend Aristocrats ETF by ProShares or SPLV, Invesco’s low-volatility ETF. Both have less price volatility and less concentration in tech stocks than SPY and QQQ. Still others are being told to buy US government bond ETFs for downside protection despite their miniscule yields.
- However, during the past 22 years, conservative advice of this nature has stunted wealth growth. QQQ and XLK, two of the few non-leveraged ETFs that have outperformed S&P 500 ETFs during this period, are even more concentrated, more tech heavy, and more overvalued by traditional measures. They both have lower valuations than SPY.
- During the past 10 years QQQ and XLK, very highly concentrated in large cap technology stocks, both grew a whopping 22% per year. In short, conservative risk mitigation tactics kept investor returns lower than simply letting the market pick large cap tech stocks for them.
What should financial advisors and investors do? It is true that no bull market will last forever, and trees do not grow to the sky. Yet, my training in non-Gaussian mathematics tells me that just because a cycle has lasted longer than any in the past does not mean that it will end any time soon or within any pre-ordained specific period. So far, investors have lost more by diversifying into more conservative options then letting it ride. Is it different now? Perhaps not right now. ValuEngine’s models give 4 checks to QQQ and XLK, meaning we rate both to outperform most ETFs. Does that mean we are in a new paradigm where investors should be advised to forget about prudent diversification and just stay with the winners? Not at all – especially where narrowly targeted technology ETFs are concerned. There will eventually be a correction but no one knows when it will be.
Prudent diversification is still prudent. Investors should be advised of the tradeoffs of diversifying out of the best performing stocks. Immediate future returns might be lower than had the switches not been made but forewarned is forearmed. This article has shown that investors did marvelously if they put $10,000 in QQQ or XLK in March 1999 and just left it there and came back after 22 years without needing the money. It also showed that the drawdowns were so substantial that many investors would not have had the ability to leave the money invested in QQQ or XLK that long. Someone who needed $5,000 would not have been able to retrieve it.
It comes down to time horizon and potential future liquidity needs. Investors with a 30-year time horizon and as much liquidity as they need for even catastrophic events should have 70% or more in market-weighted US portfolio ETFs such as VOO or VTI (see the previous blog entry for more on why VOO and not SPY). However, investors in or closer to retirement may want to strongly consider reducing but not eliminating exposures to S&P 500 and tech-heavy ETFs in favor of more conservative alternatives.