The market has been in a value phase the past 6 months which has been well documented by others. The regime change was heartily welcomed by almost all managers of value funds, both active and passive. This is because the previous 13 years have been relentlessly difficult for value managers in terms of relative performance to growth management.
All of the approximately 5,000 stocks, 16 sector groups, 140 industries, and 500 ETFs have been updated on www.ValuEngine.com
Free Two Week Trial to all 5,000 plus equities and ETFs covered by ValuEngine HERE
Since 2008 traditional value has underperformed significantly as illustrated in the chart below. ETF Trends reflect shifts and cyclicality between 1993 and 2008, but runaway outperformance by growth stocks over value stocks until the regime shift last autumn.
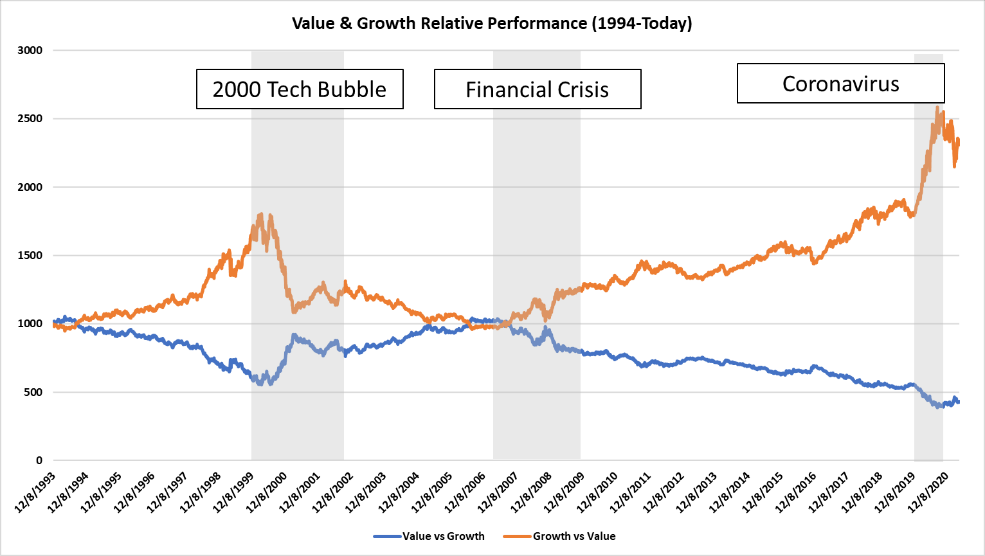
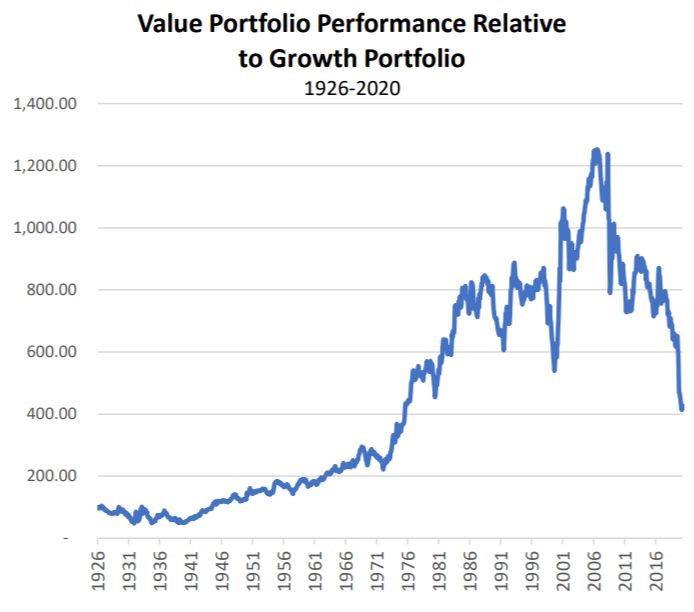
The six-month hook at the end of the chart was shown as a sign of hope and validation that the market may cycle back to value investing for the long-term. The belief in value investing is well-steeped in both academic and practitioner literature and is supported by the ratio of value-to-growth performance since 1926. On a cumulative basis, although the relative outperformance by value has declined precipitously from its overall high of greater than 1200 in 2008, it still maintains a significant advantage.
If the market is now indeed in a value cycle that still has a long way to run, which value ETFs should an investor consider? This article compares 3 popular Value ETFs:
- VOOV, S&P 500 Value ETF by Vanguard
- IUSV, iShares Core S&P Value ETF by BlackRock
- FVAL, Fidelity Large Cap Value Factor ETF by Fidelity Investments
All ETF reports updated and available: Click HERE
There are some subtle and important differences in each of the three for the time period ending 3/31/2021:
| VOOV | IUSV | FVAL | VOO | |
| YTD Return | 10.73% | 11.19% | 10.88% | 6.17% |
| 1-Yr Return | 50.24% | 52.59% | 61.48% | 56.33% |
| 3-Yr Return | 11.71% | 11.85% | 14.06% | 16.75% |
| 5-Yr Return | 12.17% | 12.58% | N/A | 16.35% |
| 10-Yr Return | 11.00% | 11.17% | N/A | 13.87% |
| Std. Deviation | 19.62% | 20.01% | 20.70% | 18.41% |
| Sharpe Ratio (3-Year) | 0.57 | 0.59 | 0.61 | 0.90 |
| # of Stocks | 438 | 744 | 128 | 500 |
| P/E Ratio | 23.4x | 23.9x | 25.0x | 29.5x |
| P/B Ratio | 2.6x | 2.6x | 3.0x | 4.2x |
| Div. Yield | 2.2% | 2.1% | 1.6% | 1.4% |
| Expense Ratio | 0.10% | 0.04% | 0.29% | 0.03% |
| Target Index | S&P 500 Value | S&P 900 Value | Fidelity US Value Factor | S&P 500 |
VOO, (Vanguard S&P 500 Index fund) is provided in the rightmost column for comparison. As a quant, the first thing I notice in this table is that the three core value ETFs look much more similar to each other in the performance characteristics than any of them do to the S&P 500 ETF. That is somewhat reassuring, indicating to me that all three of these are measuring value in a generally similar way.
How similar do they measure value? FVAL uses an optimized approach based on exposures to four value factors:
- book-value-to-price;
- earnings-to-price;
- free cash flow yield; and
- EBITDA to enterprise value.
VOOV and IUSV also use the first two factors, BV/P and E/P. These are the reciprocals of Price-to-Book and Price-to-Earnings respectively. The third factor both VOOV and IUSV use is sales-to-price. SO, VOOV and IUSV are much more similar to each other methodologically than to FVAL.
Financial Advisory Services based on ValuEngine research available:
www.ValuEngineCapital.com
On a performance basis, we note that all three value ETFs have prospered relative to VOO in the first quarter of 2021 as we would expect given the recent shift. The one-year (rolling 12-month) return is a real differentiator relative to the benchmark. VOOV and IUSV underperformed but FVAL outperformed the standard benchmark by more than 500 basis points. FVAL also easily bested IUSV and VOOV in the 3-year (rolling 36 month) category. However, since FVAL debuted in 2017, we have no data for comparison in the longer periods. When combined with its short history, FVAL’s focused approach with fewer stocks and more concentrated holdings seems a bit riskier to me. Its larger historical standard deviation tends to bear that fear out. Finally, at 0.29%, it also has what I consider a high expense ratio for a rules-based fund accessing the most liquid equity market in the world. All of the above makes my recommendation to wait-and-see on FVAL despite a promising performance history. That leaves us with IUSV and VOOV.
ValuEngine reports on each ETF: CLICK HERE
IUSV outperformed VOOV in every period measured. VOOV exhibited the best value ratios from a traditional perspective with the lowest price-earnings and price-book ratios coupled with the highest dividend yield. Let us take a deeper look behind the numbers as why these differences exist alongside pronounced similarities. VOOV and IUSV use the same rules-based construction and maintenance rules developed by S&P Dow Jones Indexes. Each stock is assigned weights based upon its measurements on the three value ratios listed above and three growth measures. This is why many of the same stocks appear in both S&P Value and Growth Indexes but with different weights.
First page of the ValuEngine report on IUSV below. Full report available on www.ValuEngine.com
Editors note: IUSV currently has a sell rating, primarily due to overall market conditions. We have been expecting a pull back in the markets for some time, with over 68% of all stocks under coverage by ValuEngine listed as Overvalued (as of yesterday’s close).
VE_IUSV_260642
Since both ETFs use the same factors and both contain the 500 largest stocks, it follows that their top 10 holdings are also the same. They are:
- Berkshire Hathaway;
- JP Morgan Chase
- Disney
- BankAmerica
- Intel Corp.
- Johnson and Johnson
- Verizon
- Exxon Mobil
- Cisco Systems
- AT&T
The differences between VOOV and IUSV predominantly are derived from the fact that they have different selection universes. The selection universe for IUSV is the S&P 900 which includes all the stocks in both the S&P 500 and the S&P Midcap 400. VOOV can select stocks only from the S&P 500.
As a group, midcap stocks have performed better than large caps in recent years. They also tend to have lower dividend yields. Taken together, this explains why IUSV has had slightly superior returns but are slightly more overpriced judging by P/E and P/B. IUSV also has a slightly lower dividend yield. The differences are all attributable to the differences between the S&P 500 and the S&P 900.
There is another difference between the two I personally find somewhat harder to explain. The expense ratio for the 438-stock fund sponsored by Vanguard, VOOV, is 2.5 times as high as the 0.04% expense ratio of IUSV, a 744-stock fund that includes less liquid midcap stocks. So much for the theory that Vanguard is always the lowest cost fund sponsor. Given higher returns, higher Sharpe ratios and lower fees than VOOV, I conclude that IUSV, iShares Core S&P Value ETF by BlackRock, provides a better value for value investors.
By Herb Blank
_______________________________________________________________________________________