The events of the past twelve months focused a lot of attention on amazing and life-altering developments made possible by the global biotech industry. Although the major names we heard were Pfizer, AstraZeneca, Johnson & Johnson and Moderna, only the last was where the original research and patents that produced the CoVid-19 vaccines were developed. Pfizer partnered with a German company called BioNTech while the other two pharmaceutical giants acquired firms with patents in genetically modified vaccines. Not that coronavirus vaccine research and clinical trials were happening in a vacuum. For example, among the clinical trials leading to FDA approval were two drugs shown to stop the spread of specific types of brain cancer. These original patents and research also originated at small biotech companies.
All of the approximately 5,000 stocks, 16 sector groups, 140 industries, and 500 ETFs have been updated on www.ValuEngine.com
Free Two Week Trial to all 5,000 plus equities and ETFs covered by ValuEngine HERE
Investing in biotech requires an understanding of the industry. Its general composition includes a few giants such as Amgen and Biogen. That said, the true growth of investments is in small cap companies that use unconventional techniques to develop potential cures. Many are one-, two- or three-patent companies that work to get approval for a very successful drug and either attract a lot of capital or get acquired by a large pharmaceutical company. Individually, these stocks are high-risk / high-return situations. Think of when Inclone collapsed resulting in the Martha Stewart mess. There is a better way to invest in this topic than individual companies, as there is far more safety and improved expected return per unit risk ratios with diversified portfolios of the stocks of Biotech companies. Biotech ETFs, particularly indexed biotech ETFs, provide means of doing just that.
This article takes you inside four Biotech ETFs:
1. ALPS Medical Breakthrough ETF (SBIO)
2, First Trust NYSE Arca Biotechnology Index Fund (FBT)
3. iShares Nasdaq Biotechnology ETF (IBB)
4. SPDR S&P Biotech ETF (XBI)
All ValuEngine ETF reports updated and available: Click HERE
Amazingly, all four ETFs are rated 5, our top rating, by the ValuEngine model. This is a distinction held by just a handful of other ETFs. The returns are also fairly highly correlated. That said, there are many important differences among them.
These ETFs follow significantly different indices constructed from quite different selection universes. Two of them, somewhat counter intuitively, confine themselves to stocks trading on a single exchange. First Trust’s FBT, the oldest, only selects biotech stocks with their primary listings on NYSE Arca. There is a legacy reason for this as the ETF was originally listed on the American Stock Exchange, the pioneer of ETF listings. When NYSE Arca eventually acquired that exchange, they took over the ETF business and any exchange-based indexes were switched over to NYSE Arca. FBT also limits itself to 30 equally weighted stocks meeting its classification criteria for the biotech subindustry. IBB from iShares follows a cap-weighted Nasdaq index that meet the subindustry classification criteria. The fund’s selection disciplines result in a much larger portfolio than FBT, currently 128 stocks However, its choice of a market-cap weighted index works against fund holding diversification as its top 5 holdings account for nearly a quarter of the fund. Despite my generalized exceptions to portfolios based upon selection universes limited by exchange of listing, ten-year holders of IBB and FBT have fared better than most as both have realized a greater 10-year annualized return than VOO, Vanguard’s S&P 500 ETF.
The remaining two ETFs have higher forecasted returns for the next year than FBT and IBB. There are many reasons to be interested in XBI and SBIO as shown by the tables below. The historical data are as of March 31, 2021. Ticker VOO, the Vanguard S&P 500 Index fund, is provided in the rightmost column for comparison.
| SBIO | FBT | IBB | XBI | VOO | |
| ValuEngine Rating | 5 | 5 | 5 | 5 | 3 |
| YTD Return | -2.05% | -4.56% | -0.54% | -3.62% | 6.17% |
| 1-Yr Return | 57.60% | 22.20% | 39.03% | 75.31% | 56.33% |
| 3-Yr Return | 14.77% | 6.50% | 12.36% | 16.77% | 16.75% |
| 5-Yr Return | 19.10% | 12.88% | 11.84% | 21.48% | 16.35% |
| 10-Yr Return | N/A | 14.58% | 16.46% | 20.20% | 13.87% |
| Volatility | 28.8% | 23.2% | 20.7% | 28.2% | 18.4% |
| Sharpe Ratio (3-Year) | 0.52 | 0.51 | 0.51 | 0.66 | 0.90 |
| # of Stocks | 101 | 30 | 128 | 192 | 500 |
| Beta | 1.22 | 0.97 | 0.92 | 1.20 | 29.5x |
| Alpha | -0.17 | -0.27 | -0.11 | -0.05 | 0.00 |
| VE Forecast 1-yr. Return | 4.41% | 0.96% | -0.73% | 3.15% | -2.18% |
| P/B Ratio | 4.6x | 4.6x | 5.7x | 4.6x | 4.2x |
| Div. Yield | 0.04% | 0.12% | 0.24% | 0.26% | 1.41% |
| Expense Ratio | 0.50% | 0.55% | 0.46% | 0.35% | 0.03% |
| Index Provider | S-Network Global Indexes by Alerian | NYSE ARCA | Nasdaq | S&P Dow Jones Indexes | S&P Dow Jones In dexes |
| Index
Scheme |
Equal Weighting | Equal Weighting | Mkt. Cap Weighting | Equal Weighting | Mkt. Cap Weighting |
| ETF Sponsor | ALPS | First Trust | iShares by Blackrock | SPDRs by SSgA | Vanguard |
A deeper dive into the methodology of SBIO and its underlying Medical Breakthroughs Index reveals a level of non-financial market research seldom seen in ETF index construction. Recognizing that the attractiveness of the smaller biotech companies depends on their patents paying off in probable FDA approval, the methodology uses clinical trial data to determine whether a constituent holds a patent on one or more drugs being clinically tested in Phase II or Phase III. I compare this research-based approach to an active management shop using alternative data to drive investment strategy. The SBIO approach has paid off well for investors, beating VOO in the 1-year and 5-year periods on an after-fee basis. SBIO also boasts the highest year-ahead return of the quartet, more than 600 basis points higher than the negative return projected for VOO. SBIO is an ETF I consider very worthy of consideration to purchase for a “satellite” allocation to supplement a core benchmarked to the S&P 500.
Financial Advisory Services based on ValuEngine research available:
www.ValuEngineCapital.com
XBI, SPDR S&P Biotech ETF, creates its equally weighted portfolio for the S&P Select Biotech Subindustry Index. This index typically holds close to 200 stocks that meet the GICS qualifications to be included in the subindustry grouping. This has been a terrific strategy, being among the very few ETFs to outperform VOO for 1- 3- 5- and 10-year periods, especially while focusing on midcap and small cap stocks.
The chart below highlights the growth of a hypothetical investment during the 5-year period ending March 31, 2021:
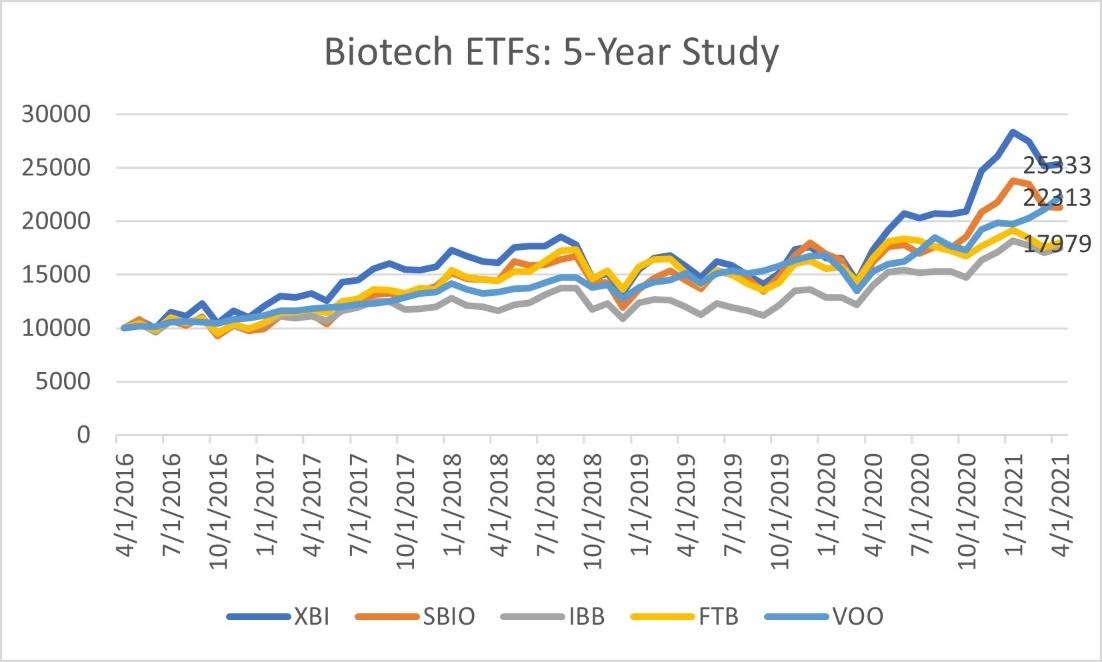
All four biotech ETFs grew fairly well but only XBI managed to top the S&P 500 ETF (VOO) for the period. SBIO did lead the index most of the way and was a very close third in wealth accumulation. The comparisons at end-date are: XBI $25,333; SBIO $21,300; IBB $17,511; FTB $17,979; VOO $22,313.
To top things off for XBI, it also has the lowest expense ratio of the four ETFs in this article making it a true bargain in addition to its continued growth potential. I recommend strongly XBI as a non-core supplemental or satellite holding. I’d even continue to hold it during market pullbacks in biotech stocks because the strategy and theory behind it are strong. Therefore, such pullbacks are likely to be followed by robust rebounds.
- Of course, no equity strategy is bullet-proof and past performances do not guarantee future results. Many of XBI stocks it holds have exhibited above-average volatility in the past. Before considering purchase of any ETF, an investor must do their own due diligence. Read the ETF Fact Sheet and download the Summary Prospectus in addition to the ValuEngine report.
- The bottom line for me is that I find this combination of XBI’s track record and ValuEngine’s top-percentile projection for 12-month gains after a 3.6% pullback year-to-date to be very compelling. To top it off, bargain hunters get to buy the best historical and projected results together with the lowest expense ratio. How often can one say that?
First page of the ValuEngine report on IUSV below. Full report available on www.ValuEngine.com
VE_XBI_260642
By Herb Blank
ValuEngine, Inc
_______________________________________________________________________________________