VALUATION WATCH: Overvalued stocks now make up 64.86% of our stocks assigned a valuation and 29.784% of those equities are calculated to be overvalued by 20% or more. Fifteen sectors are calculated to be overvalued.
ValuEngine Index Overview
|
Index
|
Week Open
|
Friday AM
|
Change
|
% Change
|
YTD
|
|
DJIA
|
19848.82
|
19816.69
|
-32.13
|
-0.16%
|
0.27%
|
|
NASDAQ
|
5555.16
|
5568.88
|
13.72
|
0.25%
|
3.45%
|
|
RUSSELL 2000
|
1371.51
|
1345.74
|
-25.77
|
-1.88%
|
-0.84%
|
|
S&P 500
|
2269.14
|
2274.41
|
5.27
|
0.23%
|
1.59%
|
ValuEngine Market Overview
|
Summary of VE Stock Universe
|
|
|
Stocks Undervalued
|
35.14% |
|
Stocks Overvalued
|
64.86% |
|
Stocks Undervalued by 20%
|
14.72% |
|
Stocks Overvalued by 20%
|
29.78% |
ValuEngine Sector Overview
|
Sector
|
Change
|
MTD
|
YTD
|
Valuation
|
Last 12-MReturn
|
P/E Ratio
|
| Multi-Sector Conglomerates |
0.10%
|
1.77%
|
1.77%
|
19.26% overvalued
|
26.70%
|
20.16
|
| Industrial Products |
0.33%
|
1.67%
|
1.67%
|
18.57% overvalued
|
38.55%
|
24.76
|
| Oils-Energy |
-0.82%
|
2.35%
|
2.35%
|
17.69% overvalued
|
63.22%
|
27.37
|
| Finance |
0.31%
|
0.61%
|
0.61%
|
14.84% overvalued
|
25.75%
|
17.92
|
| Aerospace |
0.50%
|
1.96%
|
1.96%
|
14.02% overvalued
|
22.06%
|
20.73
|
| Basic Materials |
-0.02%
|
4.96%
|
4.94%
|
13.36% overvalued
|
91.89%
|
28.66
|
| Transportation |
0.36%
|
3.46%
|
3.46%
|
11.91% overvalued
|
32.94%
|
18.63
|
| Business Services |
0.10%
|
0.37%
|
0.37%
|
11.70% overvalued
|
20.09%
|
24.41
|
| Utilities |
-0.36%
|
1.32%
|
1.32%
|
10.99% overvalued
|
28.32%
|
22.04
|
| Construction |
0.01%
|
0.58%
|
0.58%
|
10.57% overvalued
|
39.55%
|
20.40
|
| Computer and Technology |
0.27%
|
2.39%
|
2.97%
|
9.71% overvalued
|
26.81%
|
31.08
|
| Auto-Tires-Trucks |
0.05%
|
1.25%
|
1.25%
|
7.47% overvalued
|
41.71%
|
14.73
|
| Consumer Staples |
-0.12%
|
1.25%
|
1.25%
|
5.93% overvalued
|
17.25%
|
23.88
|
| Consumer Discretionary |
-0.39%
|
0.59%
|
0.59%
|
4.60% overvalued
|
27.00%
|
24.35
|
| Retail-Wholesale |
0.01%
|
-0.16%
|
-0.16%
|
0.68% overvalued
|
13.48%
|
23.08
|
| Medical |
-0.30%
|
4.64%
|
4.64%
|
4.14% undervalued
|
7.73%
|
28.07
|
Sector Talk–Basic Materials
Below, we present the latest data on Basic Materials stocks from our Professional Stock Analysis Service. Top- five lists are provided for each category. We applied some basic liquidity criteria–share price greater than $3 and average daily volume in excess of 100k shares.
Top-Five Basic Materials Stocks–Short-Term Forecast Returns
|
Ticker
|
Name
|
Mkt Price
|
Valuation (%)
|
Last 12-M Return (%)
|
|
TSE
|
TRINSEO SA
|
62.35
|
N/A
|
171.20%
|
|
TX
|
TERNIUM SA-ADR
|
23.78
|
35.30%
|
119.98%
|
|
RYI
|
RYERSON HOLDING
|
10.65
|
-13.12%
|
218.86%
|
|
SSRI
|
SILVER STD RES
|
9.89
|
N/A
|
157.22%
|
|
RYAM
|
RAYONIER ADV MT
|
15.51
|
N/A
|
120.31%
|
Top-Five Basic Materials Stocks–Momentum
|
Ticker
|
Name
|
Mkt Price
|
Valuation (%)
|
Last 12-M Return (%)
|
|
FMSA
|
FAIRMOUNT SNTRL
|
12.55
|
N/A
|
888.19%
|
|
TECK
|
TECK RESOURCES
|
23.52
|
-6.99%
|
587.72%
|
|
CC
|
CHEMOURS COMPNY
|
24.26
|
N/A
|
575.77%
|
|
CLF
|
CLIFFS NATURAL
|
9.01
|
24.71%
|
552.90%
|
|
CDE
|
COEUR MINING
|
11.19
|
-11.49%
|
546.82%
|
Top-Five Basic Materials Stocks–Composite Score
|
Ticker
|
Name
|
Mkt Price
|
Valuation (%)
|
Last 12-M Return (%)
|
|
MT
|
ARCELOR MITTAL
|
8.09
|
-23.07%
|
128.53%
|
|
TECK
|
TECK RESOURCES
|
23.52
|
-6.99%
|
587.72%
|
|
RYI
|
RYERSON HOLDING
|
10.65
|
-13.12%
|
218.86%
|
|
FOE
|
FERRO CORP
|
14.07
|
-7.82%
|
57.74%
|
|
VALE
|
VALE SA
|
9.8
|
20.22%
|
320.60%
|
Top-Five Basic Materials Stocks–Most Overvalued
|
Ticker
|
Name
|
Mkt Price
|
Valuation (%)
|
Last 12-M Return (%)
|
|
UAN
|
CVR PARTNERS LP
|
6.15
|
270.96%
|
13.05%
|
|
SLCA
|
US SILICA HOLDI
|
57.49
|
85.31%
|
284.29%
|
|
ANDE
|
ANDERSONS INC
|
36.75
|
59.77%
|
44.34%
|
|
PVG
|
PRETIUM RES INC
|
10.14
|
57.04%
|
142.58%
|
|
ALB
|
ALBEMARLE CORP
|
93.05
|
51.26%
|
92.17%
|
Free Download for Readers
As a bonus to our Free Weekly Newsletter subscribers,
we are offering a FREE DOWNLOAD of one of our Stock Reports
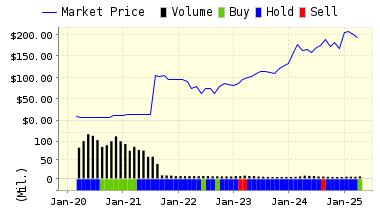
General Electric Company (GE) operates as a technology and financial services company. Its segments include Energy Infrastructure, Aviation, Healthcare, Transportation, Home & Business Solutions and GE Capital. The company’s Energy Infrastructure segment offers wind turbines; gas and steam turbines and generators. Its Aviation segment offers jet engines, turboprop and turbo shaft engines, aerospace systems and equipment. Its Healthcare segment provides medical imaging and information technologies, medical diagnostics, patient monitoring systems. Its Transportation segment provides drive technology solutions to various industries. Its Home and Business Solutions segment provides home appliances; lighting products, plant automation, hardware, software, and embedded computing systems. Its GE Capital segment offers commercial loans and leases, fleet management, financial programs, credit cards, personal loans and other financial services. General Electric Company is headquartered in Fairfield, Connecticut.
VALUENGINE RECOMMENDATION: ValuEngine continues its HOLD recommendation on General Electric for 2017-01-19. Based on the information we have gathered and our resulting research, we feel that General Electric has the probability to ROUGHLY MATCH average market performance for the next year. The company exhibits ATTRACTIVE Company Size but UNATTRACTIVE Earnings Growth Rate.
You can download a free copy of detailed report on General Electric Company (GE) from the link below.
Read our Complete Detailed Valuation Report on General Electric (GE) HERE.
|
ValuEngine Forecast
|
||
|
Target
Price* |
Expected
Return |
|
|---|---|---|
|
1-Month
|
31.19 | -0.14% |
|
3-Month
|
31.68 | 1.43% |
|
6-Month
|
31.78 | 1.75% |
|
1-Year
|
30.71 | -1.66% |
|
2-Year
|
38.13 | 22.10% |
|
3-Year
|
40.15 | 28.58% |
|
Valuation & Rankings
|
|||
|
Valuation
|
24.25% overvalued | Valuation Rank(?) |
|
|
1-M Forecast Return
|
-0.14% | 1-M Forecast Return Rank |
|
|
12-M Return
|
9.55% | Momentum Rank(?) |
|
|
Sharpe Ratio
|
0.68 | Sharpe Ratio Rank(?) |
|
|
5-Y Avg Annual Return
|
11.36% | 5-Y Avg Annual Rtn Rank |
|
|
Volatility
|
16.68% | Volatility Rank(?) |
|
|
Expected EPS Growth
|
6.00% | EPS Growth Rank(?) |
|
|
Market Cap (billions)
|
313.89 | Size Rank |
|
|
Trailing P/E Ratio
|
20.81 | Trailing P/E Rank(?) |
|
|
Forward P/E Ratio
|
19.63 | Forward P/E Ratio Rank |
|
|
PEG Ratio
|
3.47 | PEG Ratio Rank |
|
|
Price/Sales
|
2.52 | Price/Sales Rank(?) |
|
|
Market/Book
|
3.76 | Market/Book Rank(?) |
|
|
Beta
|
1.18 | Beta Rank |
|
|
Alpha
|
-0.09 | Alpha Rank |
|
What’s Hot
Market Overvaluation Remains Elevated
ValuEngine tracks more than 7000 US equities, ADRs, and foreign stock which trade on US exchanges as well as @1000 Canadian equities. When EPS estimates are available for a given equity, our model calculates a level of mispricing or valuation percentage for that equity based on earnings estimates and what the stock should be worth if the market were totally rational and efficient–an academic exercise to be sure, but one which allows for useful comparisons between equities, sectors, and industries. Using our Valuation Model, we can currently assign a VE valuation calculation to more than 2800 stocks in our US Universe.
We combine all of the equities with a valuation calculation to track market valuation figures and use them as a metric for making calls about the overall state of the market. Two factors can lower these figures– a market pullback, or a significant rise in EPS estimates. Vice-versa, a significant rally or reduction in EPS can raise the figure. Whenever we see overvaluation levels in excess of @ 65% for the overall universe and/or 27% for the overvalued by 20% or more categories, we issue a valuation warning.
We now calculate that 64.86% of the stocks to which we can assign a valuation are overvalued and 29.78% of those stocks are overvalued by 20% or more. These numbers are similar to what we saw when we published our last valuation study in November.
However, they have increased–and have ran slightly above–the levels needed to declare our first valuation warning since June, 2015. At that time, the SP500 was at the 2100 level. Needless to say, from our model’s perspective, equities are nowhere near as “cheap” as they were back in late June of this year in the aftermath of “Brexit.”
The so-called “Trump rally” or “post-election uncertainty rally” has been a boon for the stock markets. Almost every major index has made new highs and flirts with them almost every day. Things have cooled off a bit in the new year, but still, we got a nice pop to close out 2016.
Even the Fed decision to raise rates slightly in December did little to cool off the ardor for equities. Of course, we believe that the central blank should refrain from additional rate hikes until workers can fully benefit from the recovery. For now, we caution investors to remain vigilant for a move to the downside and to consider booking some profits and perhaps ad some protection against a downside move.
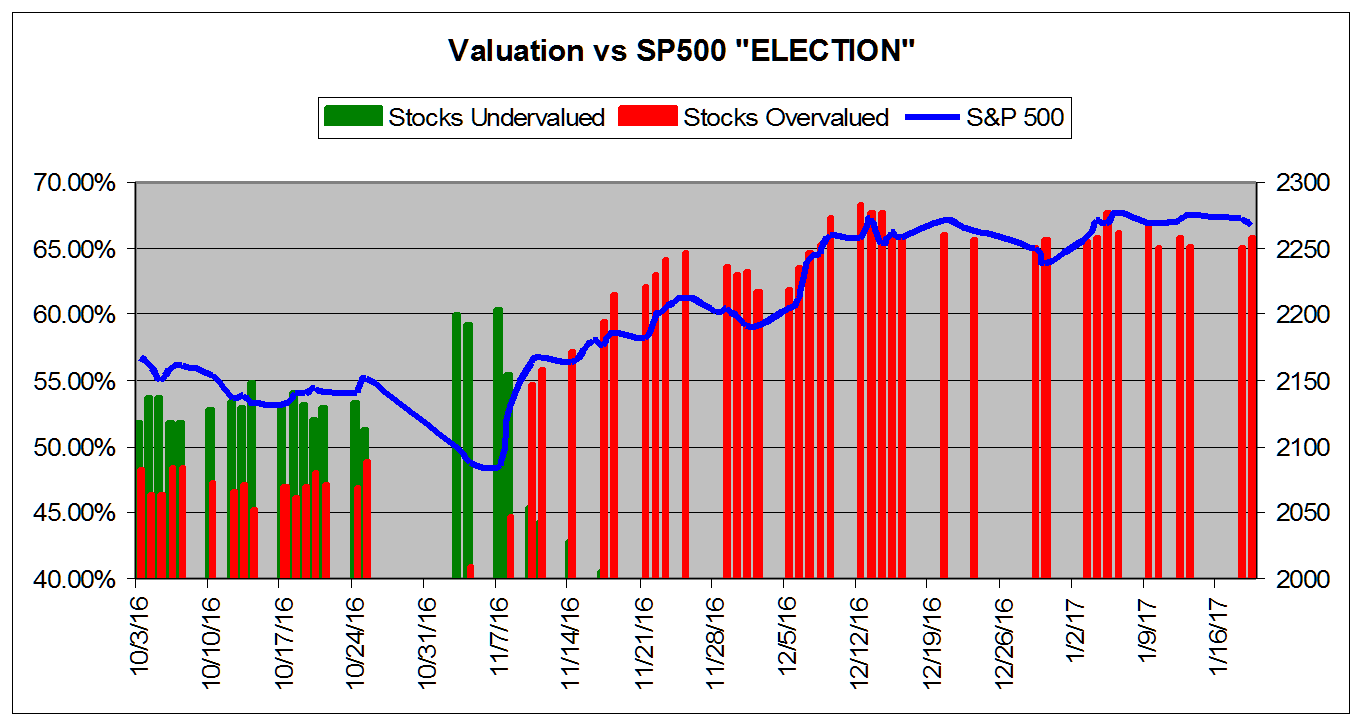
The chart below tracks the valuation metrics so far this Summer/Fall. It encompasses the lead up to the election and the post-election rally. It shows levels in excess of 40%.
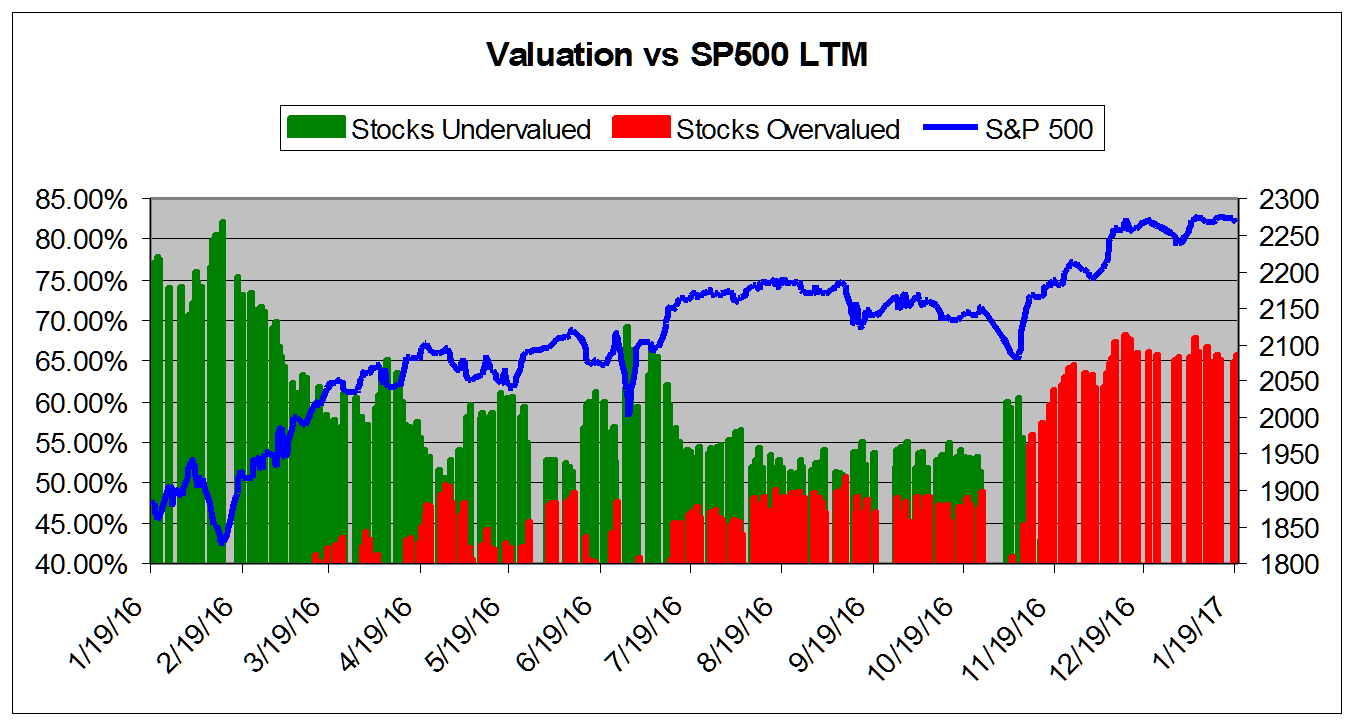
The chart below tracks the valuation metrics from January 2016. It shows levels in excess of 40%.
This chart shows overall universe over valuation in excess of 40% vs the S&P 500 from January 2014

This chart shows overall universe under and over valuation in excess of 40% vs the S&P 500 from March 2007*
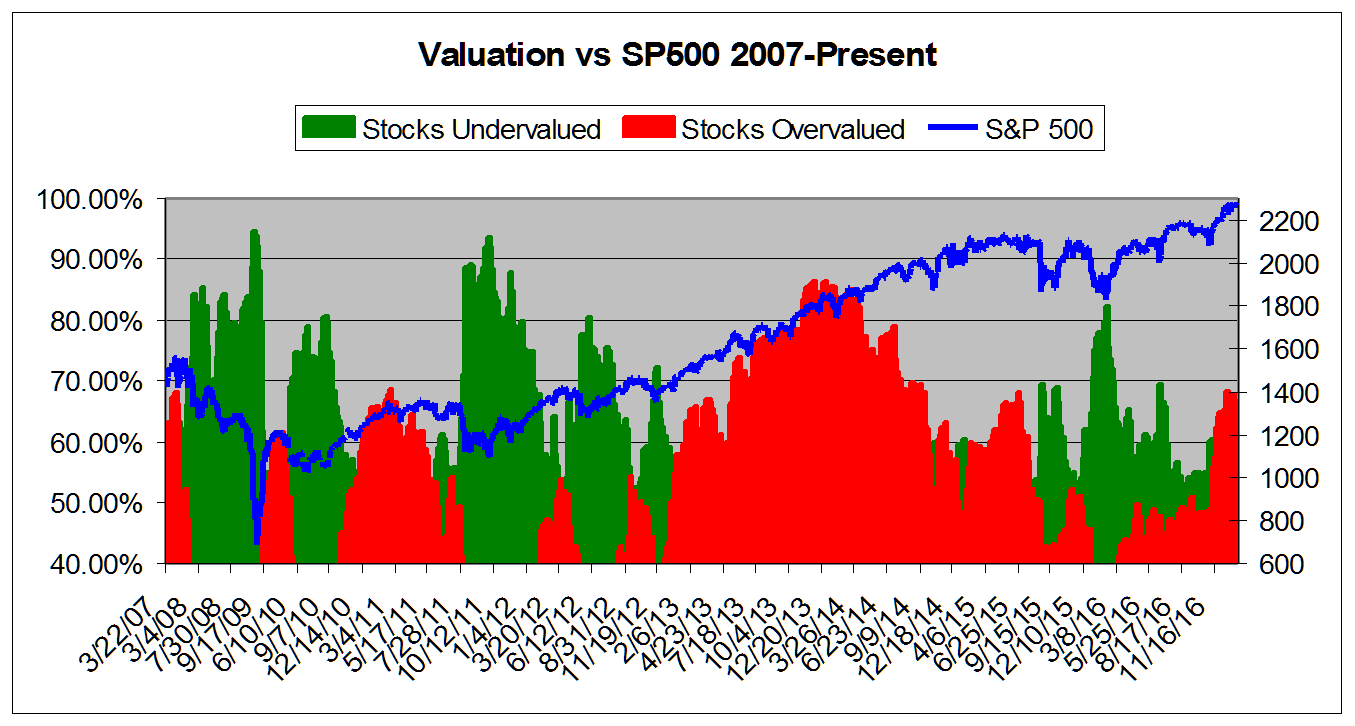
*NOTE: Time Scale Compressed Prior to 2011.
ValuEngineCapital Money Management
Services
We are pleased to announce that ValuEngine Capital has begun trading for our clients. ValuEngine Capital, a registered investment advisory firm, offers our clients investment-management services based on industry-leading ValuEngine research. ValuEngine Capital melds the cutting-edge financial theory of ValuEngine’s award-winning quantitative independent research with the best real-world Wall St. practices. ValuEngine Capital offers refined investment portfolios for investors of all risk-reward profiles.
ValuEngine Capital is offering several investment strategies to clients, including the the ValuEngine View Strategy and the ValuEngine Diversified Strategy
Professional Portfolio Management Services
ValuEngine View Strategy: The ValuEngine View Strategy is the product of a sophisticated stock valuation model that was first developed by ValuEngine’s academic research team.
- It utilizes a three factor approach: fundamental variables such as a company’s trailing 12-month Earnings-Per-Share (EPS), the analyst consensus estimate of the company’s future 12-month EPS, and the 30-year Treasury yield are all used to create a more accurate reflection of a company’s fair value.
- A total of eleven additional firm specific variables are also used. The ValuEngine View portfolio is constructed by integrating both our Aggressive Growth—based on the Valuation Model–and Diversified Growth—based on the Forecast Model– Portfolio Strategies.
- The ValuEngine View Strategy is constructed by integrating this model along with some basic rules for market capitalization and industry diversification. The portfolio has 15 stocks and is rebalanced once each month.
Strategies To Suit All Investor Types
The ValuEngine Diversified Strategy: The ValuEngine Diversified Strategy invests in a variety of asset classes in order to provide investors with stable returns and a high- dividend yield coupled with significantly lower risk than single-asset products.
- The ValuEngine Diversified Strategy may include ETFs focused on commodities, stock indices, REITS, bonds, emerging markets, and other suitable products.
- By reaping the benefits of diversification, the ValuEngine Diversified Strategy seeks to remain resilient during times of market volatility.
- The ValuEngine Diversified Strategy is designed for investors seeking management for their IRA and other retirement funds as well as those whose risk-profile is not suitable for our other strategies.
For more information, please contact us by email at info@ValuEngineCapital.com
or by phone at (407) 308-5686.
Or, sign up online with our easy-to-use portal HERE:
![]()
ValuEngine.com is an independent research provider, producing buy/hold/sell recommendations, target price, and valuations on over 7,000 US and Canadian equities every trading day.
Visit www.ValuEngine.com for more information