This week, we provide top-five ranked VE data for our Utilities Sector stocks. We take a look at our latest data on Nintendo NTDOY$ and provide a free download link for our stock report on the company.
VALUATION WATCH: Overvalued stocks now make up 56.27% of our stocks assigned a valuation and 21.45% of those equities are calculated to be overvalued by 20% or more. Twelve sectors are calculated to be overvalued.
ValuEngine Index Overview
| Index | Week Open | Friday PM | Change | % Change | YTD |
| DJIA | 23533.96 | 23421.77 | -112.19 | -0.48% | 18.52% |
| NASDAQ | 6763.3 | 6751.31 | -11.99 | -0.18% | 25.42% |
| RUSSELL 2000 | 1495.03 | 1478.18 | -16.85 | -1.13% | 8.92% |
| S&P 500 | 2587.47 | 2581.2 | -6.27 | -0.24% | 15.29% |
ValuEngine Market Overview
| Summary of VE Stock Universe | |
| Stocks Undervalued | 43.73% |
| Stocks Overvalued | 56.27% |
| Stocks Undervalued by 20% | 20.65% |
| Stocks Overvalued by 20% | 21.45% |
ValuEngine Sector Overview
| Sector | Change | MTD | YTD | Valuation | Last 12-MReturn | P/E Ratio |
| Aerospace | -1.01% | -1.78% | 14.84% | 24.17% overvalued | 34.28% | 22.69 |
| Multi-Sector Conglomerates | -0.56% | -0.11% | 13.87% | 13.00% overvalued | 14.24% | 20.85 |
| Construction | -0.43% | -0.92% | 22.79% | 10.59% overvalued | 28.85% | 22.66 |
| Computer and Technology | -0.98% | -1.41% | 27.76% | 10.38% overvalued | 21.76% | 32.49 |
| Industrial Products | -0.77% | -1.65% | 13.82% | 9.17% overvalued | 23.84% | 24.98 |
| Utilities | -0.17% | -1.98% | 19.31% | 8.67% overvalued | 16.69% | 23.98 |
| Finance | -0.18% | -0.51% | 10.60% | 6.26% overvalued | 16.20% | 18.65 |
| Consumer Discretionary | -0.17% | 0.08% | 14.62% | 2.86% overvalued | 18.00% | 24.69 |
| Auto-Tires-Trucks | -1.27% | -3.01% | 23.40% | 2.80% overvalued | 35.47% | 14.42 |
| Business Services | -0.42% | -1.20% | 9.93% | 1.91% overvalued | 13.73% | 25.54 |
| Transportation | -0.32% | -0.22% | 19.09% | 1.39% overvalued | 23.13% | 23.17 |
| Consumer Staples | 0.13% | -0.74% | 5.52% | 1.24% overvalued | 11.18% | 24.25 |
| Basic Materials | -0.40% | -0.25% | 15.97% | 2.15% undervalued | 10.81% | 26.42 |
| Medical | -0.11% | -1.30% | 17.09% | 2.47% undervalued | 15.93% | 27.99 |
| Retail-Wholesale | 0.17% | -0.99% | 0.00% | 6.64% undervalued | 7.57% | 22.76 |
| Oils-Energy | -0.04% | 3.16% | 5.55% | 12.39% undervalued | 2.74% | 28.22 |
Sector Talk–Utilities
Below, we present the latest data on Utilities stocks from our Professional Stock Analysis Service. Top- five lists are provided for each category. We applied some basic liquidity criteria–share price greater than $3 and average daily volume in excess of 100k shares.
Top-Five Utilities Stocks–Short-Term Forecast Returns
| Ticker | Name | Mkt Price | Valuation (%) | Last 12-M Return (%) |
| NNBR | NN INC | 28.6 | 26.43% | 73.33% |
| CECE | CECO ENVIRNMNTL | 8.51 | 40.66% | -11.17% |
| DE | DEERE & CO | 134.44 | 45.85% | 52.50% |
| HEES | H&E EQUIP SVCS | 33.59 | 30.69% | 149.18% |
| CMCO | COLUMBUS MCKINN | 38.36 | 42.70% | 102.11% |
Top-Five Utilities Stocks–Momentum
| Ticker | Name | Mkt Price | Valuation (%) | Last 12-M Return (%) |
| CYRX | CRYOPORT INC | 7.58 | 44.43% | 254.21% |
| MTW | MANITOWOC INC | 9.95 | 77.53% | 155.13% |
| HEES | H&E EQUIP SVCS | 33.59 | 30.69% | 149.18% |
| HSC | HARSCO CORP | 21.25 | 42.45% | 128.49% |
| CSTM | CONSTELLIUM NV | 11.55 | 18.74% | 122.12% |
Top-Five Utilities Stocks–Composite Score
| Ticker | Name | Mkt Price | Valuation (%) | Last 12-M Return (%) |
| OI | OWENS-ILLINOIS | 23.82 | -12.06% | 28.06% |
| ZBRA | ZEBRA TECH CL A | 112.7 | 13.03% | 72.19% |
| ETN | EATON CORP PLC | 79.38 | 11.97% | 30.39% |
| RBC | REGAL BELOIT | 80.2 | 11.04% | 40.95% |
| BDC | BELDEN INC | 81.93 | 8.09% | 33.11% |
Top-Five Utilities Stocks–Most Overvalued
| Ticker | Name | Mkt Price | Valuation (%) | Last 12-M Return (%) |
| MTW | MANITOWOC INC | 9.95 | 77.53% | 155.13% |
| CDXS | CODEXIS INC | 6.25 | 73.02% | 40.45% |
| CCC | CALGON CARBON | 21.8 | 48.79% | 44.85% |
| AIMC | ALTRA INDUS MOT | 48.15 | 48.17% | 64.90% |
| DE | DEERE & CO | 134.44 | 45.85% | 52.50% |
Free Download for Readers
As a bonus to our Free Weekly Newsletter subscribers,
we are offering a FREE DOWNLOAD of one of our Stock Reports
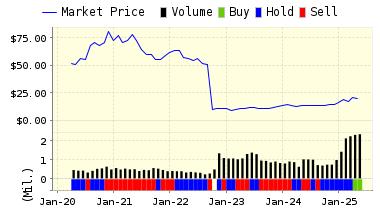
NINTENDO LTD (NTDOY) is the acknowledged worldwide leader in the creation of interactive entertainment. Nintendo has created such industry icons as Mario and Donkey Kong and launched franchises like The Legend of Zelda and Pok???mon. Nintendo manufactures and markets hardware and software for its popular home video game systems, including Nintendo 64 and Game Boy – the world’s best-selling video game system.
VALUENGINE RECOMMENDATION: ValuEngine continues its HOLD recommendation on NINTENDO LTD for 2017-11-09. Based on the information we have gathered and our resulting research, we feel that NINTENDO LTD has the probability to ROUGHLY MATCH average market performance for the next year. The company exhibits ATTRACTIVE Company Size but UNATTRACTIVE Earnings Growth Rate.
You can download a free copy of detailed report on Nintendo (NTDOY) from the link below.
Read our Complete Rating and Forecast Report HERE.
| ValuEngine Forecast | ||
| Target Price* |
Expected Return |
|
|---|---|---|
| 1-Month | 46.84 | 0.08% |
| 3-Month | 46.69 | -0.24% |
| 6-Month | 47.69 | 1.90% |
| 1-Year | 47.22 | 0.90% |
| 2-Year | 45.63 | -2.51% |
| 3-Year | 42.56 | -9.06% |
| Valuation & Rankings | |||
| Valuation | 10.73% overvalued | Valuation Rank(?) | 36 |
| 1-M Forecast Return | 0.08% | 1-M Forecast Return Rank | 57 |
| 12-M Return | 62.56% | Momentum Rank(?) | 90 |
| Sharpe Ratio | 0.59 | Sharpe Ratio Rank(?) | 77 |
| 5-Y Avg Annual Return | 22.05% | 5-Y Avg Annual Rtn Rank | 89 |
| Volatility | 37.48% | Volatility Rank(?) | 43 |
| Expected EPS Growth | -14.80% | EPS Growth Rank(?) | 10 |
| Market Cap (billions) | 53.04 | Size Rank | 98 |
| Trailing P/E Ratio | 46.18 | Trailing P/E Rank(?) | 38 |
| Forward P/E Ratio | 54.21 | Forward P/E Ratio Rank | 7 |
| PEG Ratio | n/a | PEG Ratio Rank | n/a |
| Price/Sales | 8.12 | Price/Sales Rank(?) | 14 |
| Market/Book | 4.82 | Market/Book Rank(?) | 29 |
| Beta | 0.63 | Beta Rank | 57 |
| Alpha | 0.36 | Alpha Rank | 90 |
ValuEngine.com is an Independent Research Provider (IRP), producing buy/hold/sell recommendations, target price, and valuations on over 5,000 US and Canadian equities every trading day.
Contact ValuEngine at (800) 381-5576 or support@valuengine.com
Visit www.ValuEngine.com for more information
ValuEngine Capital Management LLC is a Registered Investment Advisory (RIA) firm that trades client accounts using ValuEngine’s award-winning stock research.
Contact ValuEngine Capital at info@valuenginecapital.com
Visit www.ValuEngineCapital.com for more information